Advanced Oscilloscope Triggering and Signal Isolation

Advanced Oscilloscope Triggering and Signal Isolation

How comfortable are you with advanced triggering on an oscilloscope? In my experience, having done training for thousands of professional engineers worldwide, about 90% of oscilloscope users know about only a fraction of the extensive list of advanced triggers offered to them in modern digital oscilloscopes. An autoscale and edge trigger may work well for basic measurements, but for debug and analysis of complex signals or physical layer glitches, advanced triggers can be an extremely powerful tool to help you get your job done faster. Today’s blog will focus on what exactly triggering is, and give you a basic primer on a great webcast that we’ve posted on our YouTube channel (see the link at the end of the article for more).

What is a trigger?

Most signals you are measuring are changing rapidly, thousands or millions of times per second. In order to take that rapidly moving data and present it to you in a coherent manner, an oscilloscope needs a trigger condition. As an example, let’s say I’m a photographer being hired by an equestrian to make a photo gallery of their horses for sale. Potential buyers, who will be viewing the photos, will want the photos to all have the same frame of reference so they can compare the sizes of each horse. If each horse’s photo is taken from different angle and distance, then comparing the photos to each other to see differences is basically impossible. But, if I take each photo from the left side at a distance of 5 meters, then the differences between the photos are clear so the buyer can make an informed decision of what horse they want.

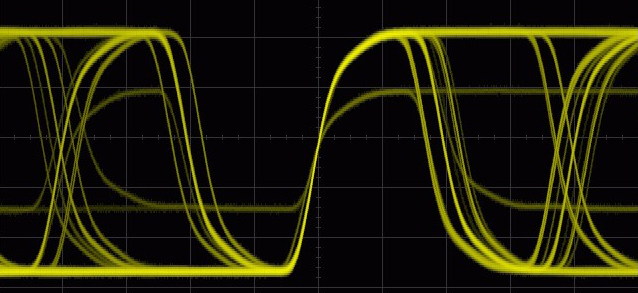
Oscilloscopes do the same thing. Today’s digital signals are complex. They are high frequency, non-repetitive, may have multiple logic levels, are often asynchronous, or are some kind of standardized serial protocol. The oscilloscope needs a rule for taking photos: when do you want a snapshot taken? The standard condition is an edge trigger. The oscilloscope takes a photo every time the signal crosses a defined voltage threshold. Consecutive photos are all overlaid on top of each other on the display, so you can view differences between each rising edge and look for anomalies. This can work well for something simple like a clock, but a complex multi-level signal may end up looking like this:

complex, multi-level signal, shown on a Keysight oscilloscope

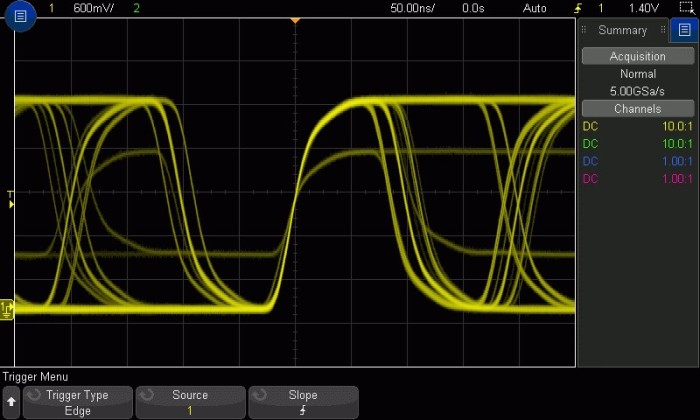
What if I am interested in one of these signals in particular? The rising edge trigger rule is not specific enough. That’s where advanced triggers come in: we need a more specifically defined rule to see exactly what we’re interested in!

Advanced Triggers

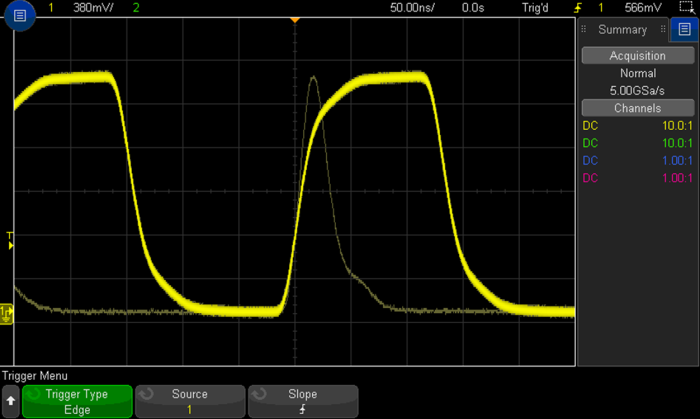
While the webcast goes over each trigger in detail, I’ll give an example of one here called pulse width trigger. With a pulse width trigger, we want the scope to take a photo if a signal rises and falls across a voltage threshold within a certain time restriction. In this signal, there is a clock with a pulse width of about 150 ns; you can see the signal crosses the trigger threshold in a rising direction, then again in a falling direction 150 ns later. The trigger threshold is visualized with the yellow T and arrow to the left of the screen, and timebase on top (50.00ns/division). But there is also a much smaller pulse the edge trigger is capturing, one that rises and falls again in under 50 ns:

Pulses captured using a basic edge trigger on a Keysight oscilloscope

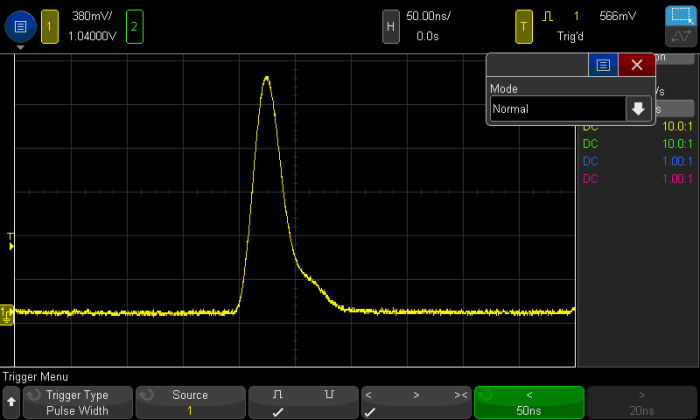
The basic edge trigger catches both. But by defining an advanced trigger, we can tell the scope to only take photos when the signal rises and falls across the trigger threshold in under 50 ns. Now, our picture is much more specific to what we want to troubleshoot:

An advanced trigger on signal pulse width provides a more targeted view

Zone Triggering

Advanced triggers require some knowledge of the signal you’re testing, its shape and parametric qualities, as well as how to set the oscilloscope up properly. This is can be very difficult or nearly impossible for most scope users. Zone trigger was designed as a point and shoot system for isolating difficult signals within your design. This topic is covered in the webcast, or you can watch this video to learn more.

Serial Bus Triggers

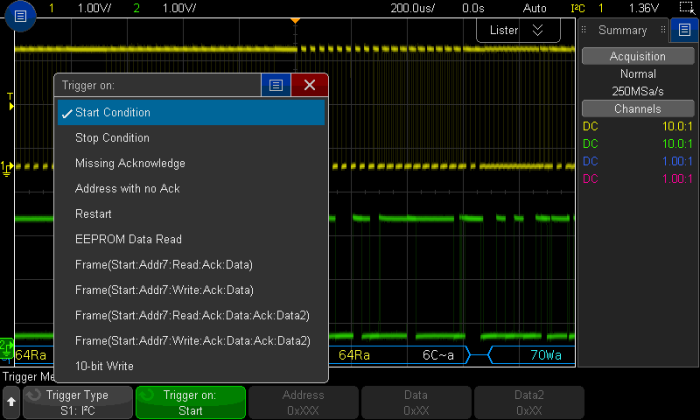
Keysight oscilloscopes also offer a suite of serial bus triggers. If you are working with an I2C bus and want to see when your device sends read commands to address 0x29, describing the shape of the signal as we did before simply will NOT work. We need a scope that is smart enough to translate the edge transitions in time to 1’s and 0’s and has knowledge of the I2C protocol. Here’s an example of the trigger capabilities for I2C:

Keysight oscilloscope trigger capabilities for I2C

Read more about how oscilloscopes can decode serial data and find the product datasheets in this blog article.

Trigger Modes and Coupling

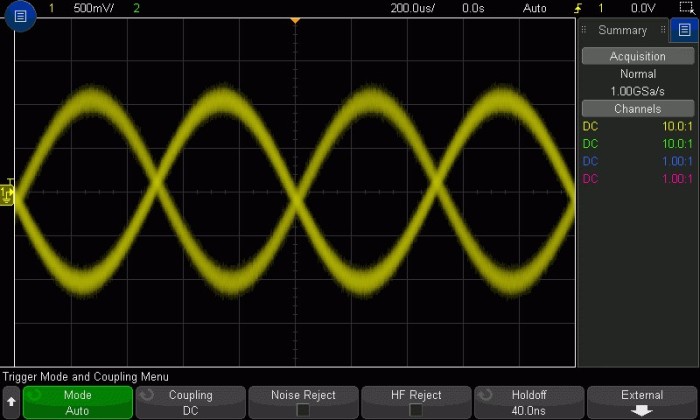
Life in the time domain is often a noisy one. And noise means triggering becomes difficult. For example, why is the scope triggering on rising and falling edges of the noisy signal below? If you zoom in, you’ll see that the falling edges of the sine wave contain small rising edges within it, that are large enough to qualify the oscilloscope to trigger. We cover all the different trigger modes and coupling techniques that can be used to make a more stable trigger in an unstable environment.  You might also try bandwidth limiting, as described aptly by Melissa here!

Use bandwidth limiting to get a more stable oscilloscope trigger

Summary

Advanced triggers can be difficult to master, and times when you need them are few and far between. Zone trigger can take a lot of that headache away, which is great. Mastery of the advanced triggers in oscilloscopes can not only separate the true power users from the rest, but also take your ability to solve problems in complex designs to a whole new level. Isolating a problem signal allows you to dive deeper in your debug process and fix bugs faster. Check out the recorded Advanced Triggering and Signal Isolation webcast on our YouTube channel.

Advanced Oscilloscope Measurements and Analysis

Advanced Oscilloscope Measurements and Analysis

Modern digital oscilloscopes are so capable it’s often impossible to use every feature available. But that doesn’t mean that you shouldn’t be aware of what your scope is capable of. As my father used to say, “can’t hurt, might help”. Today’s post is a preview of a webcast posted on our YouTube channel, the link can be found at the end of the article. The topic: advanced measurements and analysis using a Keysight InfiniiVision oscilloscope.

Measurements are critical to any oscilloscope user who is looking to analyze on their device under test. Whether it’s characterizing a functional design or characterizing bugs and glitches, the measurements menu is something with a lot of functionality. Additionally, our current oscilloscopes have dozens of features that are not traditionally found or expected from an oscilloscope – so we’ll review those as well.

Measurements

There are dozens of automated measurements included in Keysight InfiniiVision oscilloscopes, organized by type of measurement: voltage, time, mixed, and counting. Many of these measurements are tightly related – for example, peak-to-peak is a function of maximum and minimum, while amplitude is a function of base and top. While these may seem like identical measurements (isn’t peak-to-peak and amplitude the same thing?), our handy help text can define each one for you. Press and hold on any selected measurements and a diagram like this will appear. The webcast details each measurement and how it is made, for all four measurement types.

Keysight oscilloscope measurements help text

Math Functions

Measuring a signal as it exists is important, but what if you want to modify a signal? Examples of this might include “what would this signal pair look like after being passed through a differential amplifier?” or “what if I added a 5 MHz low pass filter to the circuit?” Our oscilloscopes have up to 27 math functions designed to manipulate signals in software to simulate many physical circuits. There are operators, transforms, filters, and visualizations.

Depending on the oscilloscope model, up to 4 of these can be displayed on screen simultaneously, and can save you significant development time. The subtract operator can be used on two analog channels to display the differential output, while the low pass filter can be used to emulate a 5 MHz filter on your signal, all without having to develop anything in hardware! The image below shows the simulated output of a signal through a 5 MHz low pass filter.

simulated output of a signal through a 5 MHz low pass filter on a Keysight oscilloscope

Analysis Tools

Some of the most powerful tools in the oscilloscope live in the analysis menu. Things like histograms, mask testing, eye diagrams, and frequency counters come as options in many models. While advanced triggers and measurements can help with isolating and characterizing a signal, the analysis tools in the oscilloscope are part of the final step of troubleshooting, which is root cause analysis. As an example, histograms can be used to visualize the distribution of measurements or waveforms. In this screenshot, we are looking at the distribution of period measurements over the course of a few minutes on a clock signal with some timing jitter. The shape of the histogram tells us the signal has periodic jitter due to its bimodal shape. Learn more about jitter here!

distribution of period measurements on a clock signal on a Keysight oscilloscope

Summary

After exploring each measurement, math function, and analysis tool, we take some time at the end of the webcast to show you real world examples of how all these functions can be combined to solve problems. The core purpose of an oscilloscope is to help you identify, isolate, and determine the root cause of physical layer issues in your design, and we sincerely believe that our scopes can help you do that easier and faster than anything out there! Check out the Advanced Oscilloscope Measurements and Analysis webcast video .

Thanks and happy watching!

Decoding Serial Data

Decoding Serial Data

If you are fluent in more than one language, you can appreciate how difficult it is to translate between different languages. Not only do you have to identify what languages are being spoken between two parties, but you must appreciate the nuances of each language. Often times certain words or phrases don’t translate well, creating confusion. Perhaps one person is speaking faster than you can understand, or using a local dialect you aren’t familiar with. Or what if the person you are translating for is only interested in particular words or phrases spoken by the other party? Or when the person speaks their native tongue incorrectly?

Translating for the grammar police doesn’t sound like a very fun job. But it does make for a great analogy. Engineers use test tools to translate communication protocols into readable formats to look for certain activity and errors, or to simply monitor activity on the bus. Today we’re going to talk about serial decoding, how it works, and some serious advantages for those of us who don’t speak fluent electricity. Which unless you are a superhero, is everyone!

What are your options?

Total Phase’s Beagle I2C/SPI snifferIf you’re working on design or debug of a serial bus protocol in a system, like USB, you likely have many weapons in your arsenal. A common first choice is a protocol analyzer. This tool will read out protocol layer information on the bus it’s designed to analyze. An example solution is Total Phase’s Beagle I2C/SPI sniffer. This will tell you what is being communicated and help identify improperly transmitted bits or frames. But, this tool will not tell you how or why said errors are occurring, nor show you bit timing.


Keysight 16800 Logic Analyzer

A next step might be a logic analyzer with decode capabilities. Plenty of options exist at all different price ranges depending on your channel density and speeds required. This will show you the data being transmitted in the protocol layer, and show you bit timing charts using high/low views.


Keysight Infiniium 9000 Series oscilloscope with serial bus decoding

The ultimate tool is the oscilloscope, which provides the best view of physical layer issues that could be plaguing your bus. These physical layer problems – such as noise, jitter, glitches, or unstable edges – can’t be viewed on a protocol or logic analyzer.


How does an oscilloscope decode and trigger on a serial bus?

There are two ways an oscilloscope can decode bus traffic. The first is using a software routine. An acquisition is taken, then analyzed before the next acquisition. Second is using an ASIC or FPGA. This is much faster and can be done in real time. Both methods accomplish the same thing: identifying high and low levels in time, and using a given bit rate, creating a sequence of 1’s and 0’s. Once a bit stream is translated by the oscilloscope (e.g. 10001001010110010), the protocol in question must be identified and defined. Every protocol has a syntax, and the decoded bits are fed into it to translate them to readable information to the user. Most protocols have options that can change how the data is transmitted – this can range from bit rate, address size, payload size, and bit order. All of this needs to be fed to the oscilloscope for proper translation. Once that’s done, the oscilloscope can translate information from the bus into readable information to the user!

Keysight oscilloscope serial bus decoding application software

Once that is complete, the trigger process becomes simpler. Tell the oscilloscope what you are looking for – a certain address, a certain payload, or an error – and then it will decode in the background waiting for it. Once found, it will be displayed on screen!

If you want more information on the Keysight serial bus decoding capabilities on InfiniiVision and Infiniium oscilloscopes:

InfiniiVision Serial Bus Options Data Sheet

See all of the Keysight oscilloscope serial bus software options

How to Create Bode Plots on an Oscilloscope

How to Create Bode Plots on an Oscilloscope

I discovered a great video the other day by Dave Jones of EEVBlog, in which he “tricks” our oscilloscope into creating a bode plot on screen. So today I’ll share a version of the experiment I ran and some additional improvements to bode plots on oscilloscopes that Keysight has made since 2012.
First, connect a waveform generator to the input of your device under test, and connect the output to the oscilloscope. In this simple example I breadboarded a low-pass RC circuit, so the waveform generator supplies voltage across the RC, channel one is measuring the voltage across RC, and channel two is the output across C. I default-setup the scope and offset the channels so you can see each (yellow and green).

Connect waveform generator to your DUT and oscilloscope

Next, I turned on the first waveform generator to configure the input signal. I want a 200 kHz sine wave with 5 volts peak to peak. These two shots are from the first level WaveGen1 menu.

set input signal frequency to 200 kHz

set amplitude to 5 volts peak-to-peak

Then I pressed Settings > Modulation to enter the modulation configuration. To do a bode plot, we need an input signal that sweeps the desired frequency range. I select “ramp” as the modulation waveform, and change symmetry to 100% (making the ramp into a sawtooth waveform, in essence) which will cause frequency to sweep from 0 Hz (200 k-200 k) to 400 kHz (200 k+200 k) in a linear fashion. Then I tapped the modulation key on the left to turn it on.

frequency sweeps from 0 Hz (200 k-200 k) to 400 kHz (200 k+200 k) in a linear fashion

Whoa, that’s trippy dude.

The FM frequency is set to 1 Hz so that this sawtooth frequency modulation occurs once per second (one sweep per second).

This can be observed when you kick the horizontal timebase to 100 ms/div, or one second across the screen.

change the horizontal timebase to 100 ms/div

The distinctive line in the input (yellow) is where the modulation starts the sweep over. The green waveform is the output of the filter, which is clearly attenuating as the frequency passes its 3 dB point.

Now let’s make it look like a bode plot! At this point the triggering is still setup to rising edges of channel one, which there are millions of on screen, so the trigger is anything but stable at this point. Let’s make a unique trigger, taking advantage of the output’s visible waveform characteristic. Open the trigger menu and turn it to channel 2. Also adjust the trigger level to be towards the crest of the green signal, like so (note the green arrow and T on the left of the screen).

make a unique oscilloscope trigger to create a bode plot

Then, pop into the trigger mode menu, change it to “normal” (it only triggers once a second, causing the oscilloscope to trigger automatically when in auto mode, messing up our display). Also add a holdoff of 200-500 ms so that it waits for the next period before finding another edge.

creating bode blots

Now all you have to do is scale the channel 2 waveform as such to make it appear bode-like. Of course this is a linear bode plot, not logarithmic, which is an unfortunate limitation of the waveform generator’s FM modulation schemes. If there were a logarithmic output, the output would be much more familiar. This is another reason Dave Jones used an external generator in his video.

change the oscilloscope trigger mode to normal

Finally, check the references below for a link to Dave Jones’ video, as well as a white paper on a new application for Keysight InfiniiVision oscilloscopes that can create frequency response plots with the scope and some external hardware. Thanks!

References:

Make Power Supply Control Loop Response (Bode Plot) Measurements Using a Keysight Oscilloscope

http://www.eevblog.com/2012/12/08/eevblog-396-bode-plotting-on-your-osciloscope/


How Does Signal Modulation Work?

How Does Signal Modulation Work?

To understand how wireless data transfer happens, we need to understand:

  • What is frequency?
  • Message / Data Signals
    • time representation
    • frequency representation, and why is it important?
  • How do filters work?
  • FCC Communication bands
  • Modulation and demodulation

You can spend years at University learning these subjects in depth (or on Wikipedia, if that’s your style!). This is designed to be a flash flood of knowledge. This was originally put together as a PowerPoint for non-EE students in my senior project group who were curious about our lingo when we talk about “900 MHz” or “2.4 GHz” or “Frequency Hopping”. As such, it is not complete, thorough, and skips many details that one would include in a professional analysis of a system. This is only to provide a concept of wireless transmission.

What is Frequency?

Frequency is the unit describing how often something oscillates, or goes back and forth. Units are Hertz (Hz), or the inverse of a second. Something oscillating 60 times per second has frequency 60 Hz. For our purposes, we are going to focus on audio waves (oscillation of air pressure) and how it gets broadcasted from a radio station to your car in the range of hundreds of kilohertz (or any AM radio station). Any wave has a frequency – light, for example. Generally light and other higher frequency waves (e.g. x-rays, gamma rays, microwaves) are represented by their wavelength, not frequency. For example, green light is around 400 nanometers. Here is a picture showing the relationship of units on a traveling wave:

Basic units of a sine wave.

Assuming constant speed of the signal, wavelength and frequency are interchangeable. That is outside the scope of this article, though.


Message Signals of Varying Complexity

Sending a signal that is a pure sine wave is called a “tone”. It carries no real information, and doesn’t sound that great either. Here is an image of a sine wave, with time on the X axis and voltage on the Y axis. This is 150 Hz for reference.

Single tone signal (time domain)

Okay, so why am I showing you this? Let’s take a look at increasingly complex signals in the time domain. Here is a two tone signal (two tones, added together). It is the same sine wave above, added together with another sine wave with twice the frequency, 300 Hz.

Dual tone signal (time domain)


How about a signal composed of many tones of varying frequencies:

Multi-tone signal (time domain)

It’s starting to get a bit hairy. The only real information you can gather from that is voltage level at a specified time. That’s the essence of a message, and extremely important – but makes for difficult analysis, and even more difficult for understanding the way modulation works. This is why you may want to use a different way of graphing a signal: the frequency domain. It is a representation of how strong the signal is over a range of frequencies. Let’s look.

Why is the Frequency Spectrum of a Signal Important?

There is a precise mathematical operation to convert a chunk of a signal into the frequency domain. It is dense, difficult, and takes practice to master. I even struggle with convolution of non-trivial signals regularly. Regardless, let’s see what our three signals above look like in this representation (skipping to the solution). Instead of plotting a signal’s voltage in time, we are plotting the power of the signal by frequency.

Single tone signal (frequency domain)
Dual tone signal (frequency domain)
multitone signal F
Multi-tone signal (frequency domain)


Notice the clear spikes? That is the mathematical representation of a sine wave at that particular frequency (X-axis). Ideally, these spikes would be infinitely narrow (width) and infinitely tall, but due the techniques used by my Spice software, it is imperfect. This is called an impulse signal. Read more on this here! For the tone, we see one spike at 150 Hz. The dual tone has two spikes, 150 Hz and 300 Hz. The multi-tone signal that was unreadable in the time domain has been clearly chopped into small spikes, representing all the frequencies that were summed to create the signal.

A final example would be to show an audio signal. In the below picture, I have taken a 15 second sample of the song “White Room” by Cream. Don’t worry, no microphones were damaged during Eric Clapton’s guitar solo!

Audio Signal
Audio Signal

This is how most signals appear, especially analog ones. The human voice and instruments do not play as discreet frequencies, and thus there is frequency content over an entire range (even though some of that content is almost inaudible). This range is taken from 3 Hz to 20 kHz, the approximate range of the human ear. Bass notes are lower in the range, while treble is higher. The Y-scale is represented in dB, which is a unitless representation of proportion. In essence, the higher the dB value, the more of that frequency is in the signal.

In theory, we can represent this analog signal as the sum of an infinite number of tones added together.

Filters!

Hopefully the graphical representation of frequency domains will shed some light on filter design. There are four types of filters:

  • Low Pass filter: all frequencies over the “cutoff” are removed.
  • High Pass filter: all frequencies under the “cutoff” are removed.
  • Band Pass filter: All frequencies outside a distance from the “center” are removed.
  • Band Stop filter: All frequencies within a distance from the “center” are removed.
Clockwise: Band Pass, High Pass, Low Pass filters

The “3dB” point is where signal output is reduced by ~30%. It has to do with how “log” magnitude is calculated (dB is a log scale):

x [dB] = 10 * log(x[linear])

x [linear] = 10^(x[dB]/10)

Based on this, a gain of 0.7 [linear] is approximately -3.0dB (and change). It’s what is referred to as the cutoff frequency of a filter. A practical example of this is your car stereo, which may include a “crossover”. This is a special filter design that routes low frequencies to your woofer, high ones to the tweeters, etc. This is very important in radio receivers.

FCC Communication Bands

The FCC and other organizations worldwide have agreed that it would be absolute chaos to allow anyone to use any frequency for their own use. Thus, there are special allocations of frequency ranges for different uses. Examples include FM radio, AM radio, WiFi, cell phones, maritime communications, air traffic control, HAM radios, walkie talkies, military communications, police radios, and the list goes on. We haven’t even talked about satellites or space communication, either! It’s a crazy world out there and thankfully the FCC helps organize it all. A quick Google search will provide you a more detailed image and tables if you’re curious.

The FCC Spectral Allocation Table

The FCC has left a few bands open for low range personal use, hobbyists, and other general use in the “ISM bands” (Industrial, Scientific, Medical). This is where WiFi, walkie talkies, wireless sensors, and other commercial devices operate. Let’s talk frequencies again! The human ear has a range of 20 Hz to 20 kHz. What if our AM talk station is 680 kHz? How does the radio tower get the sound up to that frequency? How does it not interfere with other stations? How does the receiver bring the signal frequency back to an audible range?

Modulation

Let’s step away from the frequency domain and go back into the time domain. I am again making generous use of my earlier disclaimer: this is over-simplified and skips many details! This is only to get the concept. The reason I say this is because the math works out best in the time domain, and a graphical representation is best served in the frequency domain.

Modulation is what takes a signal from low frequencies (the message) and pulls it up to a higher frequency (the carrier). The idea is simple: Multiply your message by a high frequency carrier, such as 680 kHz. Voila, that’s AM radio! Wait, is it really that easy? Let’s look at a few mathematical relationships. In this case, theta is the message (the audible stuff) and phi is the carrier (the AM radio frequency, for example).

time domain modulation relationships

Our AM solution involves multiplying signals, but that’s hard to imagine in the time or frequency domain, since we only have seen what tones look like. But the nifty relationships above show us that two signals multiplied can be represented as two signals added together! Now it’s easy to plot a multiplied signal in the frequency domain.

A single tone (150 Hz) modulated on a carrier (1000 Hz)

In this picture, we have multiplied a 150 Hz tone with a 1000 Hz carrier. The table above shows us to expect two, half-powered signals at 1000-150 and 1000+150 Hz, 850 Hz and 1150 Hz. What does our sound byte look like when it’s been modulated?

Modulation of a sound clip to 700 kHz

Just as expected, we see two signals. One is carrier + message, one is carrier – message (even notice how it is reversed).

Here is a crude image of an AM frequency spectrum and signal content.

AM frequency spectrum and signal content

Demodulation

Now let’s talk about receivers. All signals start at the antenna, which sees all signals at the same time as one big jumbled mess.  It isn’t the antenna’s job to sort through the mess of data it is picking up, but that of the tuner and other hardware. The theory of demodulating a signal is identical to modulating it, conveniently enough! To bring our audio signal back to “baseband” where it can be sent to a speaker, we multiply everything by the carrier again.

To bring our audio signal back to "baseband" where it can be sent to a speaker, we multiply everything by the carrier again.

That’s a bunch of math, parenthesis, and f’s all over the place. But it’s correct, and we see that there are four signals that result from it:

  • 1/4 power signal, (2*carrier + message)
  • 1/4 power signal, (message)
  • 1/4 power signal, (2*carrier – message)
  • 1/4 power signal, (-message)

Let’s immediately disregard the term with a negative frequency. It is a mathematical artifact which occurs quite often when talking about modulation and the math involved. The two signals at double the carrier (assuming the carrier is much larger than the message, they are almost the same) can be filtered out with a Low Pass Filter, which will block all higher frequency content of a signal. That just leaves us with the original message, which can be boosted with an amplifier and then sent to a speaker. Cool! Here’s a picture of it, but backwards.

Low pass filter

Conclusion

The purpose of this post was to give a 30,000 foot view of how radio transmission and signal modulation works. By taking multiple audio (or baseband) signals and mathematically multiplying them by different higher frequencies (the carrier), we can successfully transmit multiple data streams over the same channel without interference. Multiplying it by the carrier again brings the modulated signal back to baseband, and a low pass filter and amplifier clean up and magnify the signal for our listening pleasure! Please leave a comment below if you want to join the conversation!