The Keysight S-Series Oscilloscope – The best keeps getting better!

The Keysight S-Series Oscilloscope – The best keeps getting better!

We are moving to a new blogging platform this month. We’ll be posting to both platforms during the transition, but come check out our new location  https://community.keysight.com/community/keysight-blogs/oscilloscopes to see our future posts.


You may already be familiar with the Keysight S-Series oscilloscopes. They offer the best signal integrity for bandwidths up to 8 GHz, which is enabled by a set of custom technology blocks to give you:

Keysight S-Series oscilloscope

  • 4X the vertical resolution with the world’s fastest 10-bit analog to digital converter (ADC) that runs at 40 Gigasamples/sec
  • Greater signal detail from a front end with 50% less noise than other portable oscilloscopes
  • The ability to see your signal the way the components in your design see that signal with the highest effective number of bits (ENOB)
  • Superior timing and jitter measurements thanks to timebase accuracy of 12 parts per billion
  • Quick and easy analysis with more than 42 software applications
  • And more! (Intrigued? Check out the data sheet)

Whether you have already purchased an S-Series oscilloscope, or are currently in the market for something in the 500 MHZ – 8 GHz range, you’ll want to check out some of the recent enhancements that make this great oscilloscope even better.  Here are just a few:

The new N7020A Power Rail Probe

The Keysight N7020A power rail probe was designed for making power integrity measurements that need mV sensitivity when measuring noise, ripple, and transients on DC power rails. Many of today’s products have tighter tolerances on their DC power rails and the N7020A power rail probe is engineered to help assure your products meet these tighter tolerances by measuring periodic and random disturbances (PARD), static and dynamic load response, programmable power rail response and similar power integrity measurements.

Key features:

  • Low noise: 1:1 attenuation ratio probe for greater signal to noise ratio. Only 0.9 mVpp at 1 GHz and a setting of 2 mV/div
  • Large offset range: +/-24 V offset range enables you to set your oscilloscope at maximum sensitivity and have the signal centered on the screen to view down at 1 mV/div
  • Low DC loading: 50 kΩ DC input impedance will minimize load on DC power rails
  • High bandwidth: 2-GHz bandwidth makes it very useful for finding high-speed transients that can have detrimental effects on clocks and digital data

When you combine the power rail probe with the signal integrity of the S-Series you can validate power distribution design specs more accurately than any other probe/scope solution.

Keysight N7020A Power Rail probe connected to the S-Series oscilloscope
The N7020A Power Rail probe connected to the S-Series oscilloscope


The new N2820A High Sensitivity Current Probe

As modern battery-powered devices and integrated circuits become more green and energy efficient, there is a growing need to make high-sensitivity, low-level current measurements to ensure the current consumption of these devices is in acceptable limits. The Keysight N2820A high-sensitivity probe is engineered to make high-dynamic-range, high-sensitivity measurements to meet these measurement challenges.

The ultra-sensitive N2820A AC/DC current probe can support measurements from 50 uA to 5 A on Keysight oscilloscopes using a make-before-break (MBB) connector, which allows you to quickly probe multiple locations on your DUT without having to solder or unsolder the leads.

It connects to two oscilloscope channels to provide simultaneous low- and high-gain views for wider dynamic range measurement. When used in combination with the Infiniium S-Series high-definition oscilloscopes this probe can deliver the ultimate high-sensitivity measurement solution.

Keysight N2820A current probe
The Keysight N2820A current probe


Type-C Power Delivery Decode

The Keysight N8837A Type-C Protocol Trigger and Decode software is the industry’s first oscilloscope-based USB-PD protocol decode/trigger solution.  This provides insights to USB PD engineers working on ALT mode (alternate mode) for DisplayPort, Thunderbolt 3.0, and MHL.  The S-Series are the only oscilloscopes that support hardware serial trigger on BMC signals, and allow you to quickly identify the root cause of both protocol and signal integrity issues.

Type-c decoding
Keysight Type-C Power Delivery Protocol Decode


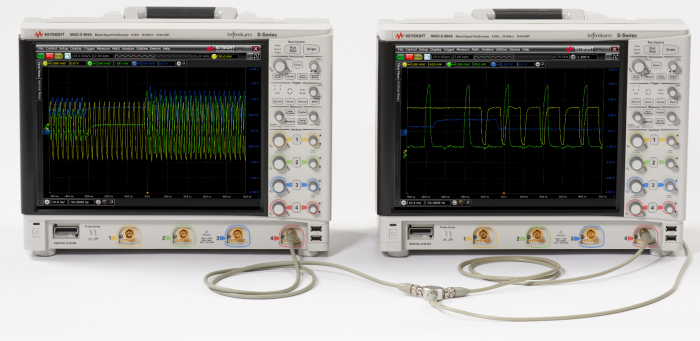
MultiScope Software Application

The Keysight MultiScope software application (N8834A) provides the ability to connect up to 10 Infiniium Series oscilloscopes for 40-channels of acquisition with a tight time correlation between the scopes with very low inter-scope intrinsic jitter.  The software allows you to perform multi-lane analysis for applications such as optical networking, MIMO, DDR memory and high-speed serial standards.  These signals are presented live on a PC with the N8900A Infiniium analysis software or on the leader scope, eliminating the need for a PC.

KeysightMultiScope

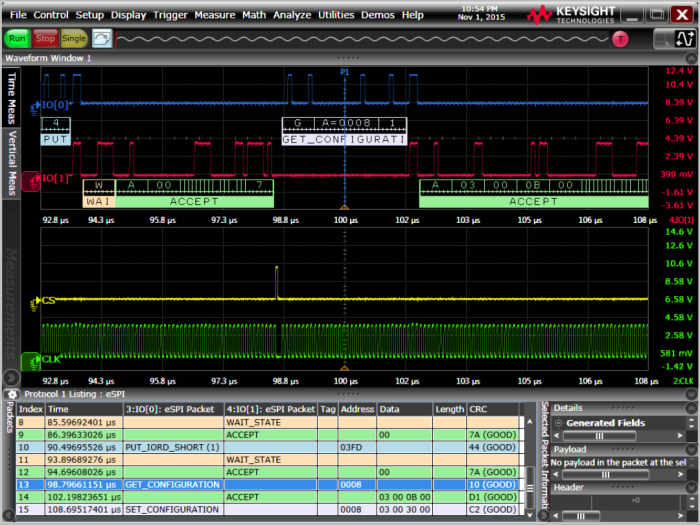
eSPI Protocol Decode and Trigger Application

The Keysight N8835A Enhanced Serial Peripheral Interface (eSPI) was developed by Intel as a successor to its Low Pin Count (LPC) bus. So it can test and trigger on not only legacy SPI data but also embedded controller (EC), baseboard management controller (BMC) and Super-I/O with extensive triggering for all key commands and responses. This standard allows designers to use 1-bit, 2-bit, or 4-bit communications at speeds from 20 to 66 MHz.

The Keysight N8835A eSPI protocol decode


New Serial Data Analysis Tool Bit Error Rate Eye Contour Software

The Keysight Serial Data Analysis tool (N5394A) has been enhanced to include Bit Error Rate (BER) eye contour capability, allowing you to cut testing time from weeks to hours!  It extrapolates noise and jitter to show how an eye will close over time at various error rates.  This allows DDR4/LPDDR4 designers to make BER measurements on command and data signals. The DDR4 and LPDDR4 JEDEC spec now have new data and timing design specifications with a Bit Error Rate of <1 x 10 -16.   The Keysight BER contour measurement method addresses these new requirements.

Keysight oscilloscope eye contours based on different bit error rates
Eye contours based on different bit error rates


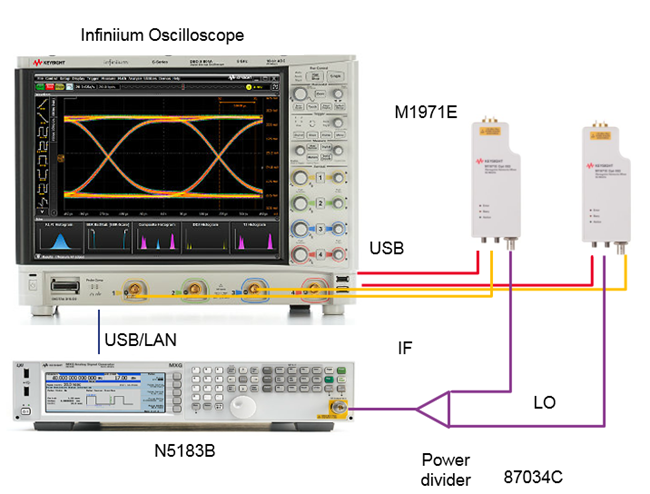
New E-Band Signal Analysis Reference Solution

The Keysight N8838A E-band signal analysis solution delivers an integrated, low-cost wideband RF testing solution.  Using a high-performance oscilloscope with an external mixer and signal generator we provide an integrated down-conversion system that delivers 2.5 GHz of analysis bandwidth over the E-band frequency range of 55 to 90 GHz.


Keysight_eband


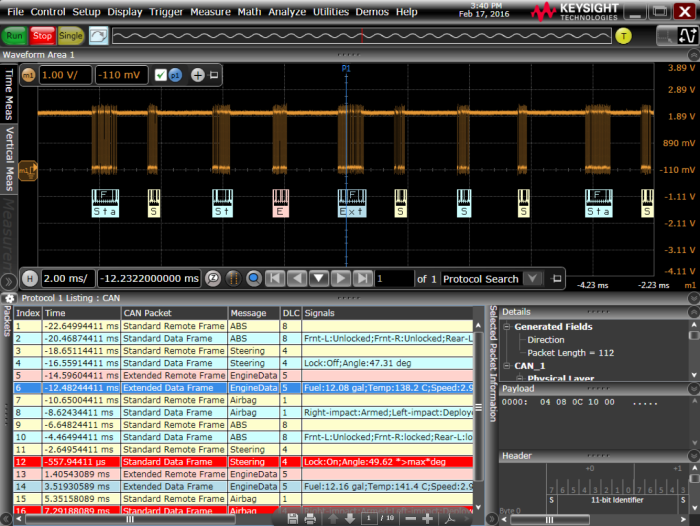
New CAN, LIN, FlexRay and CAN-FD protocol triggering and decode

The Keysight N8803C software can help electronic system designers test and debug the physical layer of automotive serial buses faster.  The CAN, LIN, FlexRay, and CAN-FD serial buses are the backbone for communication among many separate controllers, sensors, actuators, and ECUs located throughout automotive and industrial designs. These serial bus interfaces provide content-rich points for debug and test and the N8803C CAN, LIN, FlexRay, CAN-FD protocol decode is your view into these signals.

The Keysight N8803C CAN Protocol Decode Software
The N8803C CAN protocol decode software


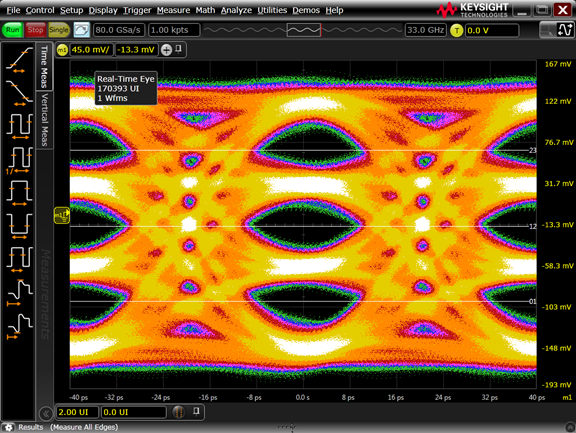
New PAM-4 Measurement Application

The Keysight N8836A analysis software helps you quickly identify design flaws by characterizing PAM-4 signals.

Available PAM-4 real-time eye measurements include:

  • Eye width, eye height, eye skew (relative) for each PAM-4 eye
  • Level mean, RMS, and “thickness” for each level

PAM-4 waveform measurements include:

  • Level mean, RMS, and “thickness” for each level
  • Data TIE for each threshold
  • Rise/Fall times for each of 6 PAM-4 transition types
  • Support for CTLE, FFE, and DFE Equalization


Keysight_PAM4


Summary

As you can see our engineering teams have been hard at work continually adding new capabilities to our S-Series oscilloscope solution set to help you get your job done faster.

How does oscilloscope signal integrity impact your measurements and analysis?

How does oscilloscope signal integrity impact your measurements and analysis?

By looking for an oscilloscope with good signal integrity you not only can impress your colleagues, but you also get:

  • More accurate wave shapes
  • More accurate and repeatable measurements
  • Wider eye diagrams
  • And less jitter

Signal integrity is the primary measure of signal quality.  When you need to view small signals, or small changes on larger signals; it is critical that you see those signals the way the components in your design see those signals.

Oscilloscopes themselves are subject to the signal integrity challenges of distortion, noise, and loss.  Scopes with superior signal integrity attributes provide a better representation of signals under test, while oscilloscopes with poor signal integrity attributes show a poorer representation of signals under test.  This difference impacts your ability to gain insight, debug, and characterize designs.

Results from oscilloscopes with poor signal integrity can increase risk in development cycles times, production quality, and components chosen.  To minimize this risk, you will want to choose an oscilloscope that has high signal integrity attributes.

Let’s take a look at some of the error attributes that effect signal integrity

The Oscilloscope’s Noise Floor

Having a scope with low noise (high dynamic range) is critical if you really want visibility to small currents and voltages, or to see small changes on larger signals.  You cannot see a signal smaller than the noise floor of the oscilloscope.

Noise can come from a variety of sources, including the front end of the oscilloscope, the analog to digital converter (ADC) in the scope and the probe or cable used connected to the device. The ADC itself has quantization error. For oscilloscopes, quantization noise typically plays a lesser role in contribution of overall noise than the front end of the oscilloscope which plays a more significant role.

Most oscilloscope vendors will characterize noise for a specific model number and include these values on the product datasheet. If not, you can find out yourself.  It’s easy to measure in just a few minutes. Disconnect all inputs from the front of the oscilloscope and set the scope to 50 Ω input path.  Set the sample rate at high.  Run the scope with infinite persistence and see how thick the resulting waveform is. The thicker the waveform, the more noise the scope is producing internally.

Each oscilloscope channel will have unique noise qualities at each vertical setting. You can view the noise visually just by looking at wave shape thickness, or you can be more analytical and take a Vrms AC measurement to quantify.   These measurements will enable you to know how much noise each oscilloscope channel has at various vertical settings to measure signals that are less than the noise of the scope. All acquired vertical values are subject to deviation up to the noise value of the oscilloscope. Noise impacts both horizontal as well as vertical measurements.

The lower your oscilloscope’s noise, the better the measurement results will be.

Keysight S-Series oscilloscope less noise       oscilloscope with more noise

Figure 1:  Keysight S-Series oscilloscope and a competitive scope analyzing the same signal.  Which would you like for your signal measurements?

Frequency Response

Each oscilloscope model will have unique frequency response that is a quantitative measure of the scope’s ability to accurately acquire signals up to the rated bandwidth. These requirements must be kept in order for oscilloscopes to accurately acquire waveforms:

  • Captured signals must be within the bandwidth of the oscilloscope
  • The scope should have a flat frequency response
  • And a flat phase response

Missing any one of these requirements will cause an oscilloscope to inaccurately acquire and draw a waveform and provide misleading measurement results.

Fast signal edges contain multiple harmonics, and scope users expect the oscilloscope to accurately measure each harmonic component using the correct magnitude. Ideally oscilloscopes would have a uniform flat magnitude response up to the bandwidth of the scope, with the signal delayed by precisely the same amount of time at all frequencies (phase). Flat frequency responses indicate that the oscilloscope is treating all frequencies equally, without a flat phase response the scope will show distorted waveforms

Frequency-response correction filters produce flat responses for both magnitude and phase for more accurate waveforms.  Some oscilloscopes have strictly analog front-end filters that determine frequency response, while others apply correction filters in real time. Combining correction filters with front-end analog filters creates flatter magnitude and phase responses verses raw analog filters alone. High-quality oscilloscopes include both analog as well as correction filters to create a uniform and flat frequency response.

flat frequency response of the Keysight S-Series oscilloscope
Figure 2: The flat frequency response of the Keysight S-Series oscilloscope


Bits of Resolution and Effective Number of Bits

The ADC is the most recognized component on the oscilloscope. It converts the analog data to digital data. It drives the oscilloscope’s bits of resolution.  It is defined by its sample rate and its signal to noise ratio.  Typically most scopes have 8 bits of resolution, although recently oscilloscopes have added 10 and 12 bit ADCs

Effective number of bits (ENOB) is a measure of the dynamic performance primarily associated with signal quantization levels of your oscilloscope. While some oscilloscope vendors may give the ENOB value of the oscilloscope’s ADC by itself, this figure has no value. ENOB of the entire system is what is important. While the ADC could have a great ENOB, poor oscilloscope front-end noise would dramatically lower the ENOB of the entire measurement system.

Oscilloscope ENOB isn’t a specific number, but rather a series of curves. ENOB is measured as a fixed amplitude sine wave that is swept in frequency. Each curve is created at a specific vertical setting while frequency is varied. The resulting voltage measurements are captured and evaluated. Using time-domain methods, ENOB is calculated by subtracting the theoretical best fit sine wave from what was measured. The error between these curves can come from the front-end of the oscilloscope from attributes such as phase non-linarites and amplitude variations over frequency sweeps.

ENOB values will always be lower than the oscilloscope’s ADC bits.  In general, a higher ENOB is better. However, a couple cautions need to accompany engineers who look exclusively at ENOB to gauge signal integrity quality. ENOB doesn’t take into account offset errors or phase distortion that the scope may inject.

ENOB of the Keysight S-Series DSOS104A 1 GHz real-time oscilloscope from 100 MHz to 1 GHz
Figure 3: ENOB of the Keysight S-Series DSOS104A 1 GHz real-time oscilloscope from 100 MHz to 1 GHz.


Intrinsic Jitter (time interval error)

An oscilloscope jitter measurement floor impacts your time interval error, decreases your eye width, can cause timing violations, and compounds accuracy of correlated measurement across channels.

Measured in picoseconds rms or picoseconds peak-to-peak.  Contributions to jitter naturally occur in high-speed digital systems. Jitter sources include thermal and random mechanical noise from crystal vibration.  Excessive jitter is bad.  If you need to make jitter measurements, understanding how well your oscilloscope will make those measurements is critical to interpreting your jitter measurement results. Oscilloscopes sample and store digitized waveforms. Each waveform is constructed of a collection of sample points. A perfect oscilloscope would acquire a waveform with all sample points equally spaced in time. However, in the real world, imperfections in the internal scope circuitry horizontally displace the ADC sample points from their ideal locations and this value is represented in the jitter measurements that the oscilloscope makes. Oscilloscopes themselves have jitter and when they make a jitter measurement, they can’t determine which portion of the jitter measurement result came from the device under test versus the scope itself.

Oscilloscope jitter can come from interleaving errors, the jitter of the ADCs sample clock input signal, and other internal sources. This is also called the intrinsic source jitter clock (SJC). Oscilloscope vendors shorten the term to “intrinsic jitter” and use this term to mean the minimum intrinsic jitter value over short time period.  Jitter measurement floor is a function of noise, signal slew rate, and intrinsic jitter.  The term “jitter measurement floor” refers to the jitter value that the oscilloscope reports when it measures a perfect jitter-free signal. The scope’s circuitry that is associated with horizontal accuracy is known as the time base. The time base is responsible for time scale accuracy as well as the horizontal component of jitter. Oscilloscopes with well-designed time bases contribute less to horizontal jitter component of jitter and hence will report a lower value.

Measuring the Jitter using a histogram of a TIE measurement
Figure 4: Measuring the Jitter using a histogram of a TIE measurement


And of course don’t forget probing

The probe connected to the oscilloscope becomes an additional load driven by the signal source.  Resistive, capacitive and inductive loading effects must be considered.   There are effects for varying lead length/span of a probe tip.  Longer wires may get you a convenience of probing physically separated test points easily, but there is a trade off in doing that.  The key here is that shorter is better.  Keep the probe’s input tips, leads, connectors, and grabbers in front of your probe input as short as possible, and you will get a better result. Learn more about this in Kenny’s earlier post: Do yourself a favor, read this.

Consider probe noise and its effects on measurement accuracy.  Choose a probe with a lower attenuation ratio for lower noise measurements.  Lower attenuation means higher signal-to-noise ratio (less noise), but lower input resistance, lower dynamic range, and lower common mode range.

Conclusion

Your oscilloscopes’ signal integrity makes a big difference in measurement results.  So choose a scope with superior signal integrity.  Evaluate noise, frequency response, ENOB, and jitter measurement floor. An easy way to do this is to ask a scope manufacturer to supply you with the data they’ve already taken.

As unit intervals continue to shrink, every picosecond matters.  You can’t afford to have your test and measurement equipment impact your measurement and analysis.  Understanding an oscilloscope’s characteristics and how they can impact your measurements is imperative.