How to extend SNR in wideband oscilloscope-based pulsed RF measurements

How to extend SNR in wideband oscilloscope-based pulsed RF measurements

Keysight Oscilloscopes Blog is moving! Come check out the same great content in our new location: https://community.keysight.com/community/keysight-blogs/oscilloscopes.

In urban slang, signal-to-noise ratio (SNR) is a simple enough concept: the ratio of useful to useless information. We all know people whose SNR is not as high as we might hope. Unfortunately there’s no technology yet available to boost their SNR.

So engineers can be happy that’s not true for RF signals. We can now extend SNR in wideband oscilloscope-based RF measurements through what’s known as “processing gain.” Digital down-conversion lets you see small pulsed RF signals next to large signals by reducing the noise level in a particular measurement—whether it’s RF pulse envelope characteristics or frequency or phase shift across a pulse.

Increase in pulsed RF capture dynamic range

So how does it work? The trick is adding vector signal analysis (VSA) software. VSA in conjunction with an oscilloscope can extend the SNR. First VSA shifts a captured signal down to baseband I/Q. Then it bandpass filters the acquired oscilloscope data and finally resamples the data at a lower sample rate. The result is lower noise, higher dynamic range, and a wider SNR.

Let’s look at an example: An 8 GHz-wideband oscilloscope captures a pulse train in which a large pulse is immediately followed by a small pulse that is 50 dB down from the first pulse. This corresponds to being 100,000 times lower in power and ~316 times smaller in voltage (sqrt[100,000]) than the first pulse. The two-pulse sequence then repeats.

The large pulse has a +6 dBm power level (~1.4 mW), which results in a peak voltage of around 633 mV into 50 ohms. This can be represented as a -4 dBVpk level (20log 0.633). It also corresponds to a 1266 mV peak-to-peak signal into 50 ohms.

In contrast, the small pulse, being 316 times smaller in voltage, is only 4 mV peak to peak (-44 dBm, -54 dBVpk).

The VSA software, which also controls the oscilloscope front-end sensitivity, is set to +6 dBm (633 mV peak). This corresponds to an oscilloscope vertical range of 1266 mV.  There are eight vertical divisions, so this also corresponds to a ~160 mV/div setting.

At the full 8-Hz bandwidth for this ~160 mV/div setting, the broadband RMS noise for the 8 GHz bandwidth oscilloscope is around 5 mV, interpolating from a noise chart in the data sheet, as shown in Table 1.  The 5 mV of noise translates roughly into a peak-to-peak noise that is three times the RMS noise (assuming Gaussian noise). In other words, we’re looking at 15 mV of peak-to-peak noise.

8GHz bandwidth oscilloscope RMS noise levels
Table 1. 8-GHz bandwidth oscilloscope RMS noise levels at various V/div settings

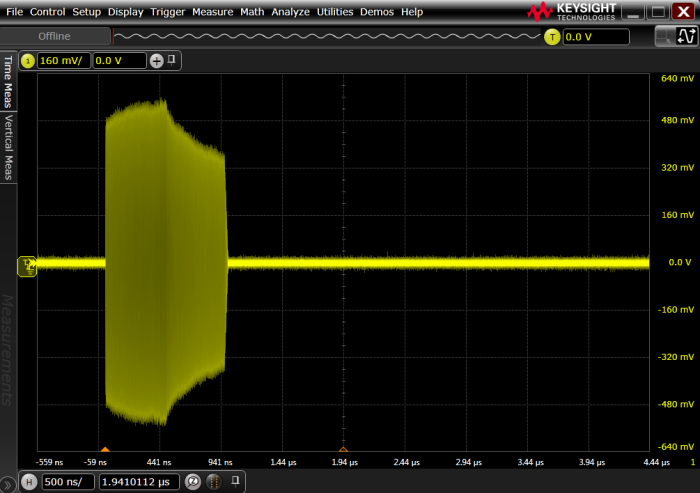
The small pulse (4 mV p-p) is masked by the noise in the measurement (15 mV p-p). (Think how easily a big-mouth can drown out softer-spoken colleagues.) The small pulse can’t be well-discerned in the full 8-GHz measurement of the oscilloscope, with a linear scale and no averaging, as shown in Figure 1.
8-GHz bandwidth oscilloscope capture of +6 dBm pulse next to a 50 dB down pulse
Figure 1. 8-GHz bandwidth oscilloscope capture of +6 dBm pulse next to a 50 dB down pulse (2nd pulse cannot be seen)


Import of real-time captured pulsed RF signals into analysis software and digital down-conversion

Basic pulsed RF measurements can be made natively on a high-bandwidth oscilloscope. And there are certainly times that measurements on directly sampled signals are desired. But this isn’t one of those times. Instead we’re looking for advantages available through external signal processing and analysis on captured signals.  For example, through a process called digital down-conversion, it’s possible to make a range of RF pulse measurements with higher accuracy. That’s due to the lower noise present by using processing gain. Let’s take a closer look.

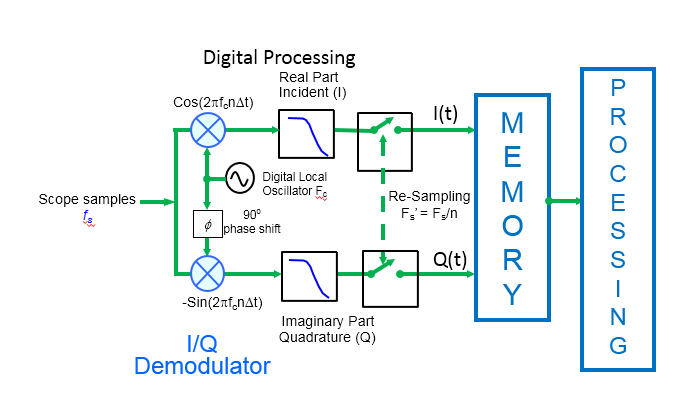
Figure 2 shows the basic process of digital down-conversion.  Through digital signal processing, the oscilloscope samples are multiplied by the sine and cosine of an imaginary oscillator of frequency fc, where fc is generally chosen to be the center frequency of the signal of interest. In effect, we’re “tuning” to the frequency of the input signal. This process converts the time samples into real and imaginary number pairs that completely describe the behavior of the input signal. To reduce noise, these samples can be low-pass filtered and then re-sampled at a lower rate to reduce the size of the data set and allow FFT processing of the data at a later stage. The resulting digitally down-converted samples can then be placed into memory for further processing.
Oscilloscope-captured samples input to VSA software for digital down-conversion
Figure 2. Oscilloscope-captured samples input to VSA software for digital down-conversion


Some important demodulation information comes from this digital down-conversion process. First, consider what happens when the digital local oscillator frequency Fc is equal to the carrier frequency of a modulated signal. The output of the digital filters, which includes the real part I(t) and imaginary part Q(t), consists of time-domain waveforms that represent the modulation on the carrier signal.

Do you want that in math? Here’s a representation of the captured input signal:

=  A(t) * Cos[2pfct +q(t)]

where the following equation describes the amplitude modulation:

amplitude modulation equation

And the equation here describes the phase modulation:

phase modulation equation

Displaying the I-Q results in terms of magnitude coordinates gives us a view of the amplitude modulation.  Displaying the I-Q results in terms of phase coordinates offers a view of the phase modulation. Taking the derivative of phase modulation yields the frequency modulation.

frequency modulation equation

By adjusting the width of the low-pass filters, you can set a defined span around the center frequency where the filter width is just wide enough to pass the signal of interest, but narrow enough to filter out a lot of the noise.


Results of digital down-conversion and processing gain on the 50-dB down RF pulse

So in short, processing gain “tunes” to the center frequency of the signal and “zooms” into the signal to analyze the modulation.

In this example, the original 8-GHz-wide measurement with the associated noise is reduced to a 500-MHz wide measurement, centered on the 3.7-GHz carrier with an instantaneous measurement bandwidth slightly wider than the width of the signal modulation.  This corresponds to an improvement in SNR as follows:

10log*(ScopeBW/Span) = 10log*(8E+09/500E+6) = 12 dB.

Taking advantage of this processing gain, combined with VSA software’s ability to have a log magnitude scale, and using averaging, the 50-dB down pulse is now visible, as shown in Figure 3.

down pulse seen with Keysight VSA software
Figure 3. 50-dB down pulse seen with VSA software “Center Frequency” and “Span” set to 3.7 GHz and 500 MHz


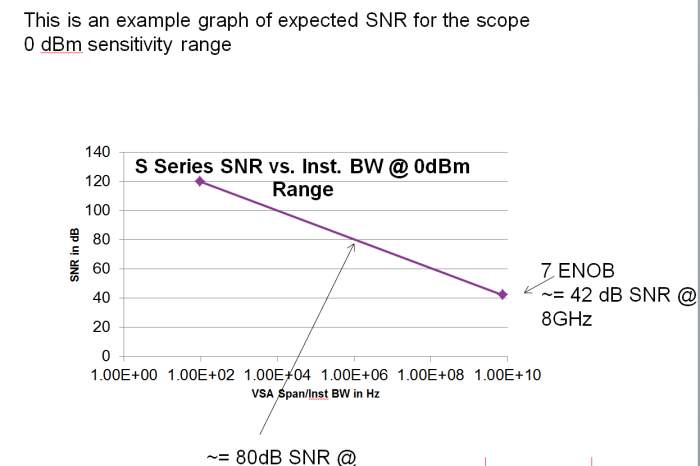
The improvement in SNR realized through narrowing down the span is depicted graphically in Figure 4.
achievable SNR
Figure 4. Plot of SNR achievable in time view verses span adjustment in VSA software


You can draw a similar plot to see improvement in dynamic range possible when measuring narrow band signals, as shown in Figure 5.

Plot of dynamic range in FFT vs. resolution BW setting in Keysight VSA software
Figure 5. Plot of dynamic range in FFT vs. resolution BW setting in VSA software


Here the dynamic range improvement when measuring narrowband signals in an FFT view is described as:

10log*(ScopeBW/RBW)

This does not describe the spur-free dynamic range (SFDR) or harmonic distortion characteristics of the oscilloscope response, but it does give an idea of where the noise floor will be in an FFT measurement.  As the resolution bandwidth is decreased, and the noise is divided among smaller time buckets, the noise floor drops.

This graph does not account for limitations due to various spurs, so the spur-free dynamic range (SFDR) remains limited to around 50 dB.


Conclusion

Through the process of digital down-conversion, the SNR of an oscilloscope measurement can be significantly improved as a function of how much that measurement can be “spanned down” from the initial DC to 3dB bandwidth of the oscilloscope.  As our example showed, a 50-dB down pulse, not even visible on a normal scope screen, can be clearly seen once processed by VSA software and then displayed in a log-magnitude scale. This approach can be very helpful to speed system validation measurements on Aerospace/Defense pulsed-RF signals. With this process, you can significantly improve measurement accuracy when evaluating the spectral, pulse envelope, frequency chirp, and phase shift characteristics of an RF pulse train.

Solving Signal Integrity Issues with I²S Protocol Triggering and Decode Software

Solving Signal Integrity Issues with I²S Protocol Triggering and Decode Software

By Rachel Beddor

The surge in low-speed serial buses in the consumer market has brought about the need for accurate protocol decoders. Traditionally, decoding a serial bus would mean a trip back to your introductory engineering class— lots of counting 1s and 0s. This method is tedious and prone to errors, so a better option is to use technology to decode serial buses. As oscilloscopes become the all-in-one lab instrument (some InfiniiVision scopes even include a function generator), separate protocol analyzers are no longer needed. I was able to explore this as an intern with Keysight this summer when I worked on the release for the I2S Protocol Triggering and Decode Software for Infiniium oscilloscopes.

The three crucial signals in an I2S bus: data, word select, and clock
The three crucial signals in an I2S bus: data (yellow), word select (blue), and clock (red).

The I2S bus is used to transfer data within audio systems. It’s a straightforward protocol consisting of a data line, word select signal and clock. From cars to laptops, the I2S bus is becoming pervasive in a range of industries, and this makes it an exciting protocol to work on as an intern. In August, Keysight released the I2S Protocol Triggering and Decode Software for Infiniium (Option N8811A). This Infiniium add-on features I2S serial bus hardware triggering*, I2S protocol decoding, and user-selectable signal alignment selections including support for time division multiplexed signals (TDM).
The increasingly popular TDM I2S signals allow for multiple lines of data to be sent over the same bus. For example, this technology could be used in an automobile, where digital audio data can be sent to front speakers and a rear woofer through the same bus. Since TDM signals might include several channels in the same packet, these signals are particularly difficult to debug without advanced software.

time division multiplexed signals in I2S protocol decode
Using TDM technology, four unique channels of data are sent through a single I²S data line.

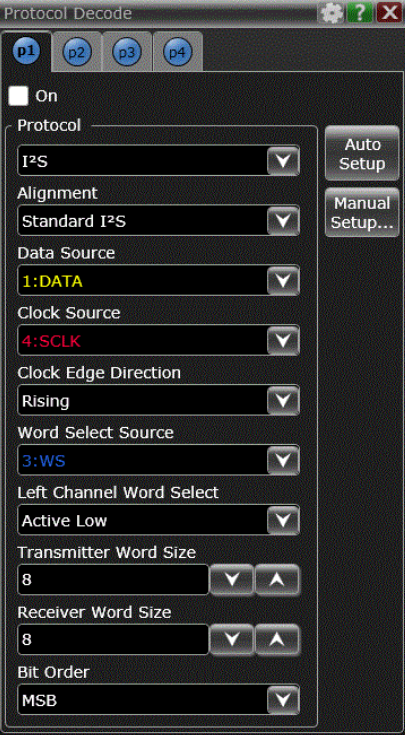
In addition to TDM alignment, the I2S Protocol Triggering and Decode Software supports standard I2S, left-justified and right-justified signals. Any decode only requires three inputs: the data, word select, and clock line of an I2S bus. On a Keysight MSO, these can be either analog or digital inputs.

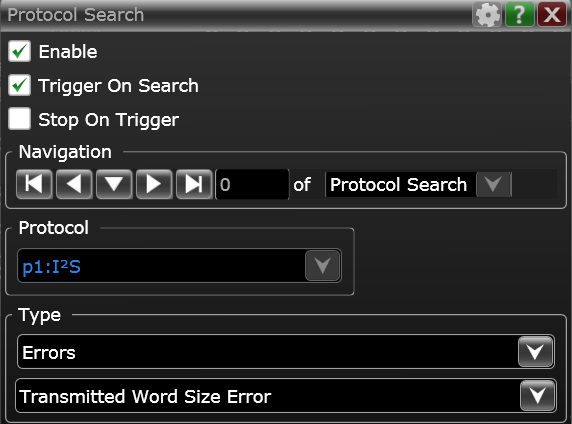
Keysight Infiniium protocol search option
The protocol search tool makes finding errors effortless. Trigger on specific packets, conditions and errors.

Throughout the industry, protocol decoding has never been simpler, more flexible or more reliable. With this new technology, you can be confident in your ability to decode any I2S signal – including TDM – and customize your decode to suit your specific application. Want to read your results in Hex? It’s just a tap on the screen. Want to use a digital clock signal but an analog data signal? It’s a touch of a button. Want to turn your instrument into an alarm clock? Well…you might want to check out this video first https://youtu.be/4sqmvzxFISE.

In all seriousness, ultimately what I found most impressive about Keysight’s software throughout my internship experience was the ease of use. I came to the office with only two years of engineering school and I knew absolutely nothing about serial buses—I complained that a spec that used the term “slave mode” wasn’t PC.

To be honest, the Infiniium oscilloscope software made my job really easy — it’s not just accurate, it’s intuitive. Every scope has a built-in help menu and demos for protocol decode applications so I could figure everything out on my own.

Infiniium oscilloscope software has built-in help menus and demos for protocol decode
You really can’t mess this up.

Keysight’s I2S Protocol Triggering and Decode Software for Infiniium oscilloscopes may be the best I2S protocol application. But it wasn’t programmed for a serial bus, it was programmed for people. That’s what sets Keysight apart, and that’s how you’re going to solve your signal integrity problems.


*S-Series only

Solutions, Solutions, Solutions!

Solutions, Solutions, Solutions!

It seems like all we hear about today in the test and measurement industry is “solutions.” Why is the word “solutions” such a popular buzz word? Well, it has a great double meaning. The first (and most obvious) definition of solution is an answer or resolution to a problem or situation. The second meaning of “solution” comes from as far back as the year 1590, and means a liquid mixture that is completely mixed (solute into solvent). When we talk about solutions, we really imply both of these definitions. One of them literally, and one of them metaphorically.

Let’s start with the literal meaning. When I say that our DDR solution kicks booty (metaphorically, not literally), what I mean is that we have a robust, industry-proven oscilloscope that will simplify the complicated task of triggering, analyzing and debugging parallel buses. If you work with DDR, you’re probably now thinking, “tell me more about this solution.” Ok, here goes:

“The Keysight Infiniium V-Series oscilloscopes also have the world’s fastest digital channels, which means you can probe at the various command signals to easily trigger on the different DDR commands such as read, write, activate, precharge and more. DDR triggering makes read and write separation easy, providing fast electrical characterization, real-time eye analysis and timing measurements. The DDR protocol decoder can decipher the DDR packets and provide a time-aligned listing window to search for specific packet information.”

So I may have copied that from our DDR webpage, but it doesn’t count as plagiarizing if it’s from my own company. And, it’s one heckuva solution because it does the job you’ll need it to do, and it does it well. If it didn’t get the job done, it wouldn’t be a solution. I also can’t just call it an oscilloscope, because it’s more than that. It’s a combination of hardware, software, and probing – it’s a whole solution.

But here’s what it comes down to, we call it a solution because it’s the answer to a lot of your DDR problems, and it’s so much more than just a piece of hardware for your bench.

Ok, I hinted above about how this could get metaphorical. The literal, chemistry definition of solution is a liquid mixture that has a fully dissolved (same root word as solution!) solute in a solvent. I don’t literally work with solutions. But when we at Keysight are combining and integrating software and hardware, we’re creating a metaphorical solution. For us to do the job 100% of the way, our software has to fully integrate (or dissolve) with our hardware. That’s what makes it a solution. It flows, it integrates, it works as one!

Ok, I also hinted that I’d get (possibly too) philosophical.  I’ll go so far as to say that we can’t really call it a solution until it’s in the hands of an engineer and being used to find solutions to bugs in their design. A solution can only be a solution when the test equipment is fully integrated (dissolved) into an engineer’s workflow and design process. The solution consists of the test tools (the solute) and the engineer’s skill and wit (the solvent). In chemistry, the solute is considered the “minor component” and the solvent is considered the “major component.” This holds true for our metaphorical solution. We can only do so much to provide the solute, the real quality of the solution is dictated by you, the solvent!

So, there’s really two main reasons we talk about solutions. 1st, we want to convey that we can help solve your problems with a combination of tools. 2nd, we want to partner with you to create and find the real solution, a combination of quality equipment and quality engineering.

In closing, a haiku:

Solutions, complex
Combine wit and expertise
to solve tough problems

Or more traditional English:

Roses are red
Violets are blue
I’m an engineer not a poet
solutions.

Author’s note: there may or may not have been a challenge to see how many times I could use the word “solutions” in a blog post. The answer is 32. Solutions. 33.

Advanced Oscilloscope Triggering and Signal Isolation

Advanced Oscilloscope Triggering and Signal Isolation

How comfortable are you with advanced triggering on an oscilloscope? In my experience, having done training for thousands of professional engineers worldwide, about 90% of oscilloscope users know about only a fraction of the extensive list of advanced triggers offered to them in modern digital oscilloscopes. An autoscale and edge trigger may work well for basic measurements, but for debug and analysis of complex signals or physical layer glitches, advanced triggers can be an extremely powerful tool to help you get your job done faster. Today’s blog will focus on what exactly triggering is, and give you a basic primer on a great webcast that we’ve posted on our YouTube channel (see the link at the end of the article for more).

What is a trigger?

Most signals you are measuring are changing rapidly, thousands or millions of times per second. In order to take that rapidly moving data and present it to you in a coherent manner, an oscilloscope needs a trigger condition. As an example, let’s say I’m a photographer being hired by an equestrian to make a photo gallery of their horses for sale. Potential buyers, who will be viewing the photos, will want the photos to all have the same frame of reference so they can compare the sizes of each horse. If each horse’s photo is taken from different angle and distance, then comparing the photos to each other to see differences is basically impossible. But, if I take each photo from the left side at a distance of 5 meters, then the differences between the photos are clear so the buyer can make an informed decision of what horse they want.

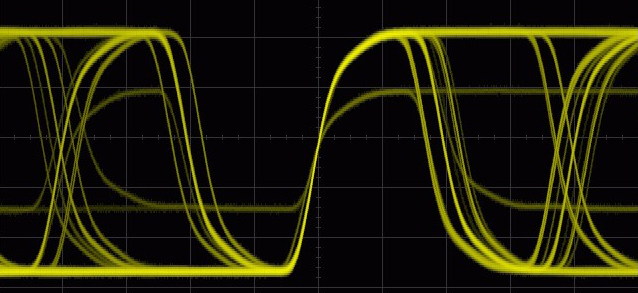
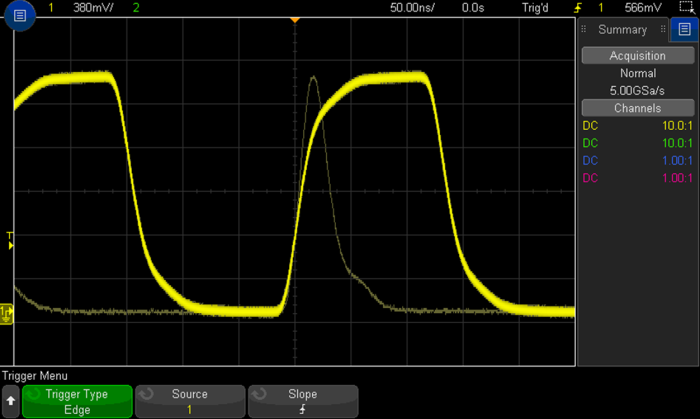
Oscilloscopes do the same thing. Today’s digital signals are complex. They are high frequency, non-repetitive, may have multiple logic levels, are often asynchronous, or are some kind of standardized serial protocol. The oscilloscope needs a rule for taking photos: when do you want a snapshot taken? The standard condition is an edge trigger. The oscilloscope takes a photo every time the signal crosses a defined voltage threshold. Consecutive photos are all overlaid on top of each other on the display, so you can view differences between each rising edge and look for anomalies. This can work well for something simple like a clock, but a complex multi-level signal may end up looking like this:

complex, multi-level signal, shown on a Keysight oscilloscope

What if I am interested in one of these signals in particular? The rising edge trigger rule is not specific enough. That’s where advanced triggers come in: we need a more specifically defined rule to see exactly what we’re interested in!

Advanced Triggers

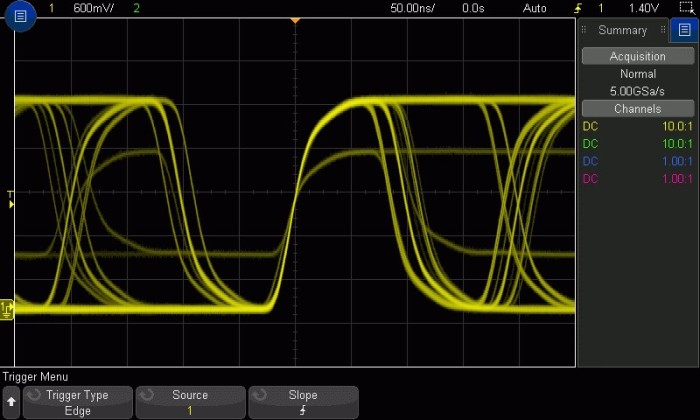
While the webcast goes over each trigger in detail, I’ll give an example of one here called pulse width trigger. With a pulse width trigger, we want the scope to take a photo if a signal rises and falls across a voltage threshold within a certain time restriction. In this signal, there is a clock with a pulse width of about 150 ns; you can see the signal crosses the trigger threshold in a rising direction, then again in a falling direction 150 ns later. The trigger threshold is visualized with the yellow T and arrow to the left of the screen, and timebase on top (50.00ns/division). But there is also a much smaller pulse the edge trigger is capturing, one that rises and falls again in under 50 ns:

Pulses captured using a basic edge trigger on a Keysight oscilloscope

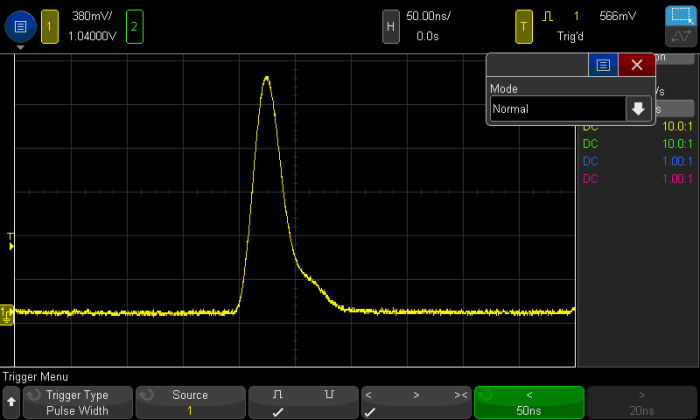
The basic edge trigger catches both. But by defining an advanced trigger, we can tell the scope to only take photos when the signal rises and falls across the trigger threshold in under 50 ns. Now, our picture is much more specific to what we want to troubleshoot:

An advanced trigger on signal pulse width provides a more targeted view

Zone Triggering

Advanced triggers require some knowledge of the signal you’re testing, its shape and parametric qualities, as well as how to set the oscilloscope up properly. This is can be very difficult or nearly impossible for most scope users. Zone trigger was designed as a point and shoot system for isolating difficult signals within your design. This topic is covered in the webcast, or you can watch this video to learn more.

Serial Bus Triggers

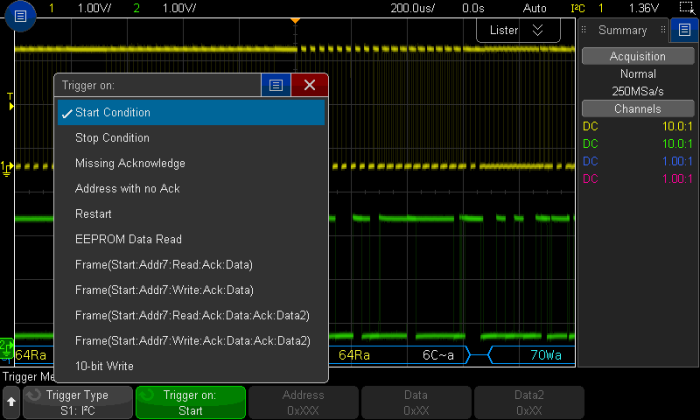
Keysight oscilloscopes also offer a suite of serial bus triggers. If you are working with an I2C bus and want to see when your device sends read commands to address 0x29, describing the shape of the signal as we did before simply will NOT work. We need a scope that is smart enough to translate the edge transitions in time to 1’s and 0’s and has knowledge of the I2C protocol. Here’s an example of the trigger capabilities for I2C:

Keysight oscilloscope trigger capabilities for I2C

Read more about how oscilloscopes can decode serial data and find the product datasheets in this blog article.

Trigger Modes and Coupling

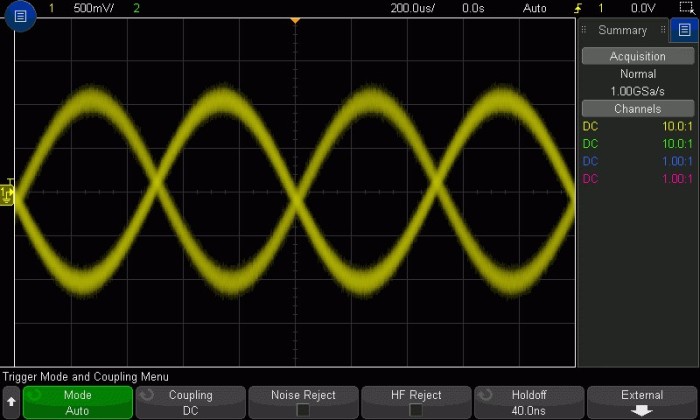
Life in the time domain is often a noisy one. And noise means triggering becomes difficult. For example, why is the scope triggering on rising and falling edges of the noisy signal below? If you zoom in, you’ll see that the falling edges of the sine wave contain small rising edges within it, that are large enough to qualify the oscilloscope to trigger. We cover all the different trigger modes and coupling techniques that can be used to make a more stable trigger in an unstable environment.  You might also try bandwidth limiting, as described aptly by Melissa here!

Use bandwidth limiting to get a more stable oscilloscope trigger

Summary

Advanced triggers can be difficult to master, and times when you need them are few and far between. Zone trigger can take a lot of that headache away, which is great. Mastery of the advanced triggers in oscilloscopes can not only separate the true power users from the rest, but also take your ability to solve problems in complex designs to a whole new level. Isolating a problem signal allows you to dive deeper in your debug process and fix bugs faster. Check out the recorded Advanced Triggering and Signal Isolation webcast on our YouTube channel.

Finding middle ground in the conflict between wide analysis bandwidth and long capture times

Finding middle ground in the conflict between wide analysis bandwidth and long capture times

We are moving to a new blogging platform this month. We’ll be posting to both platforms during the transition, but come check out our new location  https://community.keysight.com/community/keysight-blogs/oscilloscopes to see our future posts.


Battlefield scenarios can set up competing forces for radar/EW designers as well. Many seconds or minutes may go by as a scenario plays out with a clear winner and loser. But emulating this scenario with multi-emitter signal sources and multi-channel receivers is nontrivial. Designers need wide analysis bandwidth in measurements on hardware; they also need to evaluate a significant time period of system activity. Given this conflict, this class of pulsed RF, microwave, and mmWave applications presents a challenge.

On the signal source side, the technique of using pulse descriptor words (PDWs) is changing the game with regard to throughput and real-time signal creation. On the receiver side, if direct digitization techniques are used for amplitude and phase flatness advantages, as is the case when using some high-bandwidth oscilloscopes, the related high-speed sampling approach will burn through acquisition memory very quickly. But “segmented memory” can save the day: Signals of interest are placed into memory segments, and the receiver ignores the time when signals of interest are not present, as shown in Figure 1.

Oscilloscope segmented memory diagram
Figure 1. The segmented memory approach, where signals of interest are stored into memory segments

This blog post explores how segmented memory in wideband oscilloscopes can be used through pulse analysis software. We’ll address the application area of Radar/EW in terms of pulse amplitude, frequency, and phase measurements, and how you can optimize accuracy.

Oscilloscope segmented memory helps you achieve long target-time capture in pulsed RF applications

In most basic pulsed RF measurements with an oscilloscope, you take measurements on a single RF pulse from a pulse train or on a limited number of pulses. And that makes sense—a fast sample rate (adequate to capture carrier plus modulation without aliasing) uses up the scope memory depth quickly. Consider an example where a pulsed RF signal has a 15-GHz carrier frequency and 2-GHz-wide modulation.

The oscilloscope must sample fast enough to handle the modulated 15-GHz RF pulse signal.  That requires a sample rate of at least ~ 2.5 x 16 GHz, or 40 GSa/sec. To have some margin beyond the 2-GHz modulation on the carrier, and to avoid the roll-off of the scope bandwidth, the next highest sample rate selectable is the full 80 GSa/sec of the oscilloscope for 33-GHz bandwidth capture.

Using a standard capture approach, where all samples simply go into the available memory regardless of what signals are present, and using the full 2-Gpts memory depth available, that corresponds to 25 msec of capture time:

(2 GSa) / (80 GSa/sec) = 25 msec

But let’s consider a different example, where a pulse train has a pulse repetition interval of 100 μusec (a pulse repetition rate [PRI] of 10 kHz) and 1-usec wide pulses. The related scope capture includes close to 250 pulses based on the following calculation:

(25 msec) / (100 μsec / pulse) = 250 pulses

By using oscilloscope segmented memory, you can dramatically increase the number of pulses captured.  With segmented memory mode, the 2 Gpts of memory depth can be broken into smaller segments. Each segment gets filled with captured trace after a trigger condition is met. In this case, the trigger event is still the beginning of the RF pulse, and segments can be defined to be a little longer than the longest pulse captured.  For example, you can use a 1.2-μsec-wide segment size can to capture the 1-usec-wide pulses, for example.

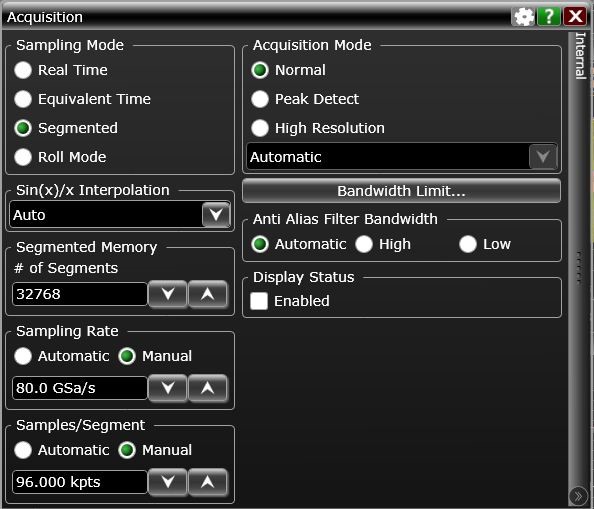
The segmented memory capture can be set up to achieve 1.2-μsec wide segments where the memory depth is chosen to be 96 kpoints and 32,768 segments, as shown in Figure 2.

Segmented memory setup on a Keysight oscilloscope
Figure 2. Segmented memory setup using 1.2-usec wide segments for 1-usec-wide pulse capture

The calculation for the required segment memory depth is simple. If you know that the sample rate is 80 GSa/sec and you want a 1.2-μsec segment length, then:


(80 GSa/sec) x (1.2 μsec) = 96,000 samples

With this choice, up to 32k segments can be selected.  Press the “Single” capture button, and 32k pulses are captured and brought into 32k segments. That corresponds to 3.3 seconds of target activity time. Is this gapless capture? No, but it is capture that focused on capturing RF pulses and ignored the time when no signal is present. Contrast this with Real Time Sampling Mode, which had 25 msec of gapless capture of 250 RF pulses.

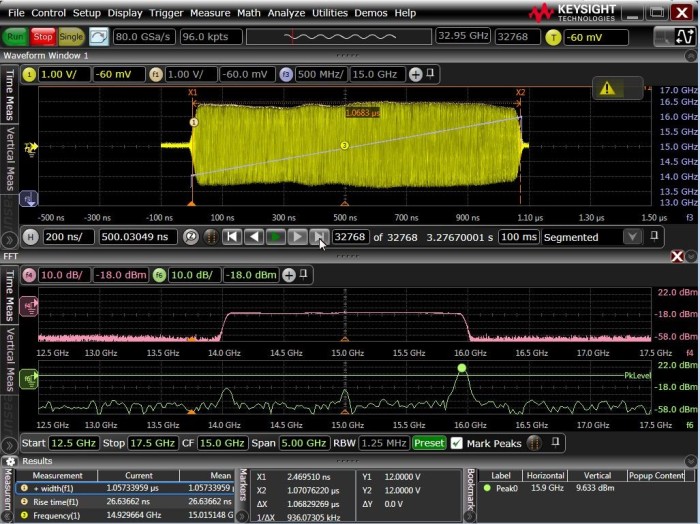
The segmented capture can be seen in Figure 3, taken on a pulsed RF signal with a 15-GHz carrier and 2-GHz-wide linear FM chirp modulation. You can even use the “Play” button to play back the 32k segments. Statistics are calculated on the 32k pulses that were captured.

Keysight oscilloscope segmented memory capture
Figure 3. 33-GHz oscilloscope segmented memory capture of 32k pulses into 32k segments, 1.2 usec per segment

You can make similar measurements on lower frequency signals using a mid-range 8-GHz bandwidth oscilloscope. With 20-GSa/sec sampling rate on two inputs channels and 800 Msamples of memory depth, a “Single” capture can be spread across multiple memory segments.  These oscilloscopes offer 10 GSa/sec sampling across four channels as well.

There are also oscilloscopes with 63 GHz of bandwidth on two channels, with 160 GSa/sec sampling rate and a 2 Gpts memory depth.  They offer 80 GSa/sec sampling rate capture on four channels with a 2-Gpts memory depth.

Enhance measurements with oscilloscope segmented memory combined with pulse analysis software

You can control segmented memory with vector signal analysis (VSA) software. VSA lets you conduct statistical pulse analysis on many RF pulses captured into segmented memory. For example, you can perform analysis on digitally down-converted oscilloscope samples, where the format is now baseband I/Q, the measurement has been tuned to the center frequency, and a frequency analysis span is chosen to be just a little wider than the signal spectral width. This allows processing gain to reduce noise in the measurement.

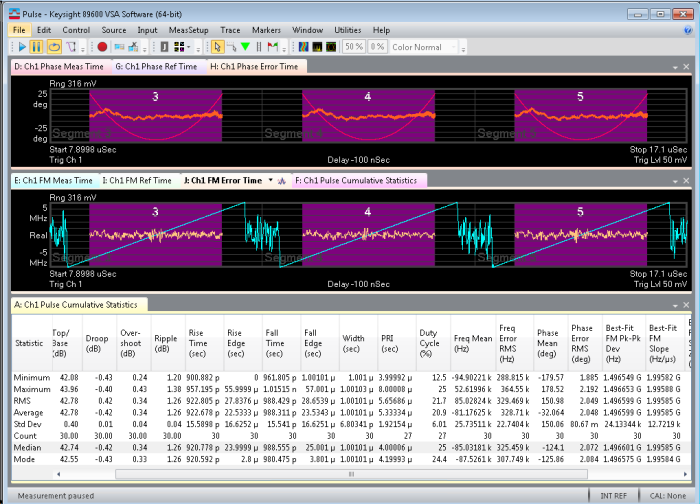
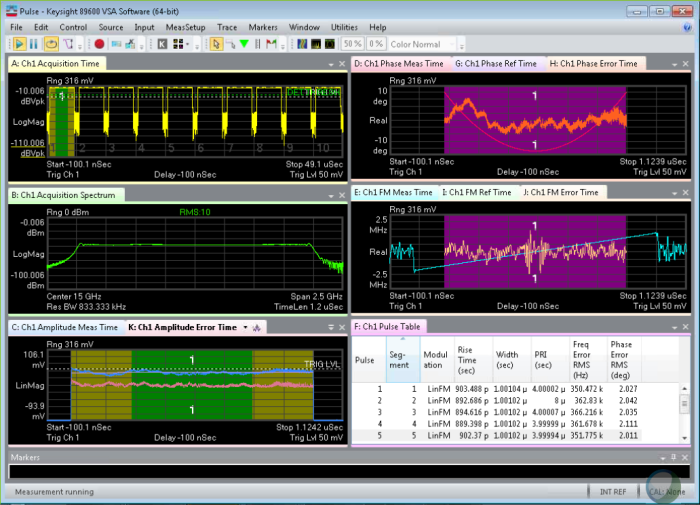
After noise reduction, many measurements can be taken on the I/Q data, including how the amplitude, frequency, and phase change across an RF pulse. Figure 4 shows an example of these measurements, where memory segments 3, 4, and 5 and the pulses contained in those segments are being analyzed.

In this example, the linear FM chirp-frequency shift across the RF pulse is measured and compared to a best-fit linear ramp. (Check the right pane center).  The difference between the measured pulse and the best-fit straight line ramp is calculated and displayed (horizontal trace with noise).  You can see that the measured ramp and reference ramp have very little difference between them. The error trace is displayed with a 1 MHz/div scale and around 500-kHz peak deviation; the Freq Error RMS in the right bottom right shows around 300 kHz of frequency error.

In a similar way, the phase shift across a pulse is compared to a best-fit parabolic phase shift (see right top pane), characteristic of linear FM chirp modulation on radar pulses. You can zoom in on the difference between the measured and reference to see how much a target system is deviating from the ideal. Here we see around +8 and -5 degrees peak deviation and a Phase Error RMS of 2 degrees, as shown in the bottom right table of Figure 4.

Keysight pulse analysis software calculations
Figure 4. Pulse analysis software calculations based on measurements taken on oscilloscope segmented memory

The left center pane shows the spectral content of the RF pulse, the left upper pane displays a view of RF pulse envelope amplitude, and the left lower pane shows the difference between the measured amplitude envelope and a best-fit straight-line reference signal.

Finally, you can perform statistical analysis on the measured parameters on the number of pulses captured into segments. In Figure 5, the statistical analysis can be seen in the pulse table based on capture of 1000 memory segments.

Statistical analysis on 1000 oscilloscope memory segments
Figure 5. Statistical analysis on 1000 memory segments


Summary

When directly capturing wideband pulsed RF signals, the fast sampling rate required can make the capture of many pulses a challenge. The available acquisition memory gets eaten up quickly. Segmented memory is one way to address this problem by acquiring RF pulses into memory segments, and then turning off the acquisition during “quiet” time until the next RF pulse occurs.

Pulse-analysis software can both control a segmented memory capture and digitally down-convert captured signals into baseband I/Q data. This effectively tunes the measurement to a specific carrier frequency with a frequency measurement span slightly wider than the signal under test—reducing noise and increasing measurement accuracy. The time required for system validation decreases thanks to the capability to compare actual, measured pulse characteristics against ideal, relative, best-fit reference signals for amplitude, frequency, and phase. With that, you can identify issues in signal creation or system performance, and overcome the challenges that battlefield scenarios present.

The Keysight S-Series Oscilloscope – The best keeps getting better!

The Keysight S-Series Oscilloscope – The best keeps getting better!

We are moving to a new blogging platform this month. We’ll be posting to both platforms during the transition, but come check out our new location  https://community.keysight.com/community/keysight-blogs/oscilloscopes to see our future posts.


You may already be familiar with the Keysight S-Series oscilloscopes. They offer the best signal integrity for bandwidths up to 8 GHz, which is enabled by a set of custom technology blocks to give you:

Keysight S-Series oscilloscope

  • 4X the vertical resolution with the world’s fastest 10-bit analog to digital converter (ADC) that runs at 40 Gigasamples/sec
  • Greater signal detail from a front end with 50% less noise than other portable oscilloscopes
  • The ability to see your signal the way the components in your design see that signal with the highest effective number of bits (ENOB)
  • Superior timing and jitter measurements thanks to timebase accuracy of 12 parts per billion
  • Quick and easy analysis with more than 42 software applications
  • And more! (Intrigued? Check out the data sheet)

Whether you have already purchased an S-Series oscilloscope, or are currently in the market for something in the 500 MHZ – 8 GHz range, you’ll want to check out some of the recent enhancements that make this great oscilloscope even better.  Here are just a few:

The new N7020A Power Rail Probe

The Keysight N7020A power rail probe was designed for making power integrity measurements that need mV sensitivity when measuring noise, ripple, and transients on DC power rails. Many of today’s products have tighter tolerances on their DC power rails and the N7020A power rail probe is engineered to help assure your products meet these tighter tolerances by measuring periodic and random disturbances (PARD), static and dynamic load response, programmable power rail response and similar power integrity measurements.

Key features:

  • Low noise: 1:1 attenuation ratio probe for greater signal to noise ratio. Only 0.9 mVpp at 1 GHz and a setting of 2 mV/div
  • Large offset range: +/-24 V offset range enables you to set your oscilloscope at maximum sensitivity and have the signal centered on the screen to view down at 1 mV/div
  • Low DC loading: 50 kΩ DC input impedance will minimize load on DC power rails
  • High bandwidth: 2-GHz bandwidth makes it very useful for finding high-speed transients that can have detrimental effects on clocks and digital data

When you combine the power rail probe with the signal integrity of the S-Series you can validate power distribution design specs more accurately than any other probe/scope solution.

Keysight N7020A Power Rail probe connected to the S-Series oscilloscope
The N7020A Power Rail probe connected to the S-Series oscilloscope


The new N2820A High Sensitivity Current Probe

As modern battery-powered devices and integrated circuits become more green and energy efficient, there is a growing need to make high-sensitivity, low-level current measurements to ensure the current consumption of these devices is in acceptable limits. The Keysight N2820A high-sensitivity probe is engineered to make high-dynamic-range, high-sensitivity measurements to meet these measurement challenges.

The ultra-sensitive N2820A AC/DC current probe can support measurements from 50 uA to 5 A on Keysight oscilloscopes using a make-before-break (MBB) connector, which allows you to quickly probe multiple locations on your DUT without having to solder or unsolder the leads.

It connects to two oscilloscope channels to provide simultaneous low- and high-gain views for wider dynamic range measurement. When used in combination with the Infiniium S-Series high-definition oscilloscopes this probe can deliver the ultimate high-sensitivity measurement solution.

Keysight N2820A current probe
The Keysight N2820A current probe


Type-C Power Delivery Decode

The Keysight N8837A Type-C Protocol Trigger and Decode software is the industry’s first oscilloscope-based USB-PD protocol decode/trigger solution.  This provides insights to USB PD engineers working on ALT mode (alternate mode) for DisplayPort, Thunderbolt 3.0, and MHL.  The S-Series are the only oscilloscopes that support hardware serial trigger on BMC signals, and allow you to quickly identify the root cause of both protocol and signal integrity issues.

Type-c decoding
Keysight Type-C Power Delivery Protocol Decode


MultiScope Software Application

The Keysight MultiScope software application (N8834A) provides the ability to connect up to 10 Infiniium Series oscilloscopes for 40-channels of acquisition with a tight time correlation between the scopes with very low inter-scope intrinsic jitter.  The software allows you to perform multi-lane analysis for applications such as optical networking, MIMO, DDR memory and high-speed serial standards.  These signals are presented live on a PC with the N8900A Infiniium analysis software or on the leader scope, eliminating the need for a PC.

KeysightMultiScope

eSPI Protocol Decode and Trigger Application

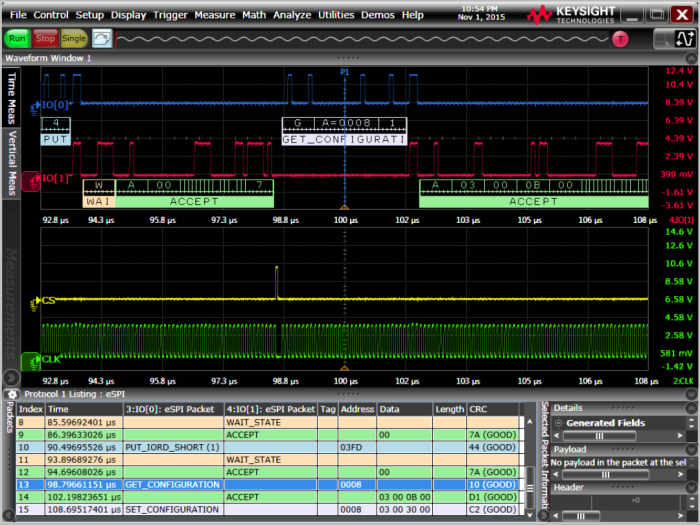
The Keysight N8835A Enhanced Serial Peripheral Interface (eSPI) was developed by Intel as a successor to its Low Pin Count (LPC) bus. So it can test and trigger on not only legacy SPI data but also embedded controller (EC), baseboard management controller (BMC) and Super-I/O with extensive triggering for all key commands and responses. This standard allows designers to use 1-bit, 2-bit, or 4-bit communications at speeds from 20 to 66 MHz.

The Keysight N8835A eSPI protocol decode


New Serial Data Analysis Tool Bit Error Rate Eye Contour Software

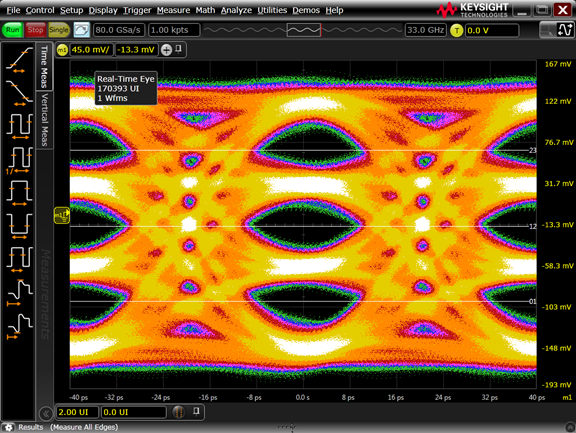
The Keysight Serial Data Analysis tool (N5394A) has been enhanced to include Bit Error Rate (BER) eye contour capability, allowing you to cut testing time from weeks to hours!  It extrapolates noise and jitter to show how an eye will close over time at various error rates.  This allows DDR4/LPDDR4 designers to make BER measurements on command and data signals. The DDR4 and LPDDR4 JEDEC spec now have new data and timing design specifications with a Bit Error Rate of <1 x 10 -16.   The Keysight BER contour measurement method addresses these new requirements.

Keysight oscilloscope eye contours based on different bit error rates
Eye contours based on different bit error rates


New E-Band Signal Analysis Reference Solution

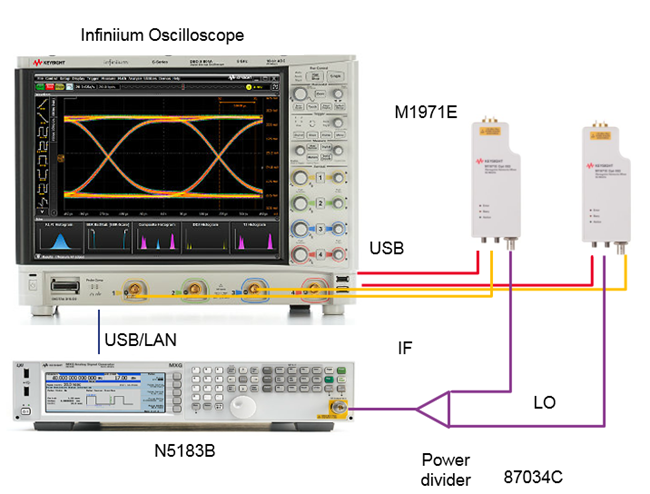
The Keysight N8838A E-band signal analysis solution delivers an integrated, low-cost wideband RF testing solution.  Using a high-performance oscilloscope with an external mixer and signal generator we provide an integrated down-conversion system that delivers 2.5 GHz of analysis bandwidth over the E-band frequency range of 55 to 90 GHz.


Keysight_eband


New CAN, LIN, FlexRay and CAN-FD protocol triggering and decode

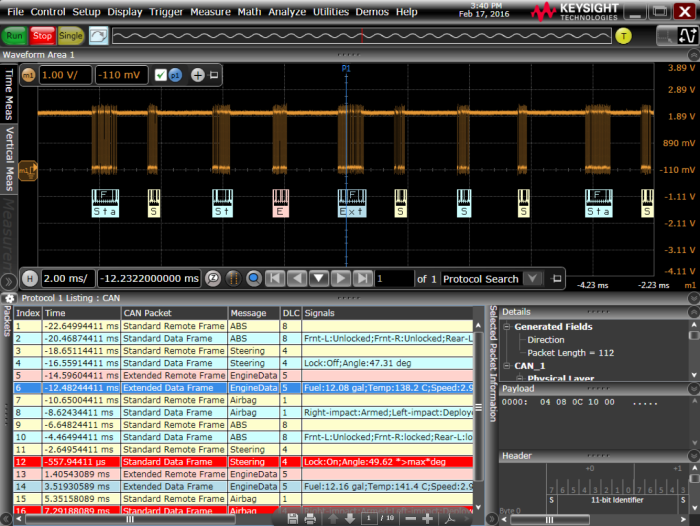
The Keysight N8803C software can help electronic system designers test and debug the physical layer of automotive serial buses faster.  The CAN, LIN, FlexRay, and CAN-FD serial buses are the backbone for communication among many separate controllers, sensors, actuators, and ECUs located throughout automotive and industrial designs. These serial bus interfaces provide content-rich points for debug and test and the N8803C CAN, LIN, FlexRay, CAN-FD protocol decode is your view into these signals.

The Keysight N8803C CAN Protocol Decode Software
The N8803C CAN protocol decode software


New PAM-4 Measurement Application

The Keysight N8836A analysis software helps you quickly identify design flaws by characterizing PAM-4 signals.

Available PAM-4 real-time eye measurements include:

  • Eye width, eye height, eye skew (relative) for each PAM-4 eye
  • Level mean, RMS, and “thickness” for each level

PAM-4 waveform measurements include:

  • Level mean, RMS, and “thickness” for each level
  • Data TIE for each threshold
  • Rise/Fall times for each of 6 PAM-4 transition types
  • Support for CTLE, FFE, and DFE Equalization


Keysight_PAM4


Summary

As you can see our engineering teams have been hard at work continually adding new capabilities to our S-Series oscilloscope solution set to help you get your job done faster.

Advanced Oscilloscope Measurements and Analysis

Advanced Oscilloscope Measurements and Analysis

Modern digital oscilloscopes are so capable it’s often impossible to use every feature available. But that doesn’t mean that you shouldn’t be aware of what your scope is capable of. As my father used to say, “can’t hurt, might help”. Today’s post is a preview of a webcast posted on our YouTube channel, the link can be found at the end of the article. The topic: advanced measurements and analysis using a Keysight InfiniiVision oscilloscope.

Measurements are critical to any oscilloscope user who is looking to analyze on their device under test. Whether it’s characterizing a functional design or characterizing bugs and glitches, the measurements menu is something with a lot of functionality. Additionally, our current oscilloscopes have dozens of features that are not traditionally found or expected from an oscilloscope – so we’ll review those as well.

Measurements

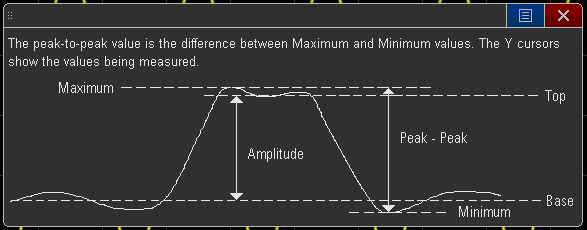
There are dozens of automated measurements included in Keysight InfiniiVision oscilloscopes, organized by type of measurement: voltage, time, mixed, and counting. Many of these measurements are tightly related – for example, peak-to-peak is a function of maximum and minimum, while amplitude is a function of base and top. While these may seem like identical measurements (isn’t peak-to-peak and amplitude the same thing?), our handy help text can define each one for you. Press and hold on any selected measurements and a diagram like this will appear. The webcast details each measurement and how it is made, for all four measurement types.

Keysight oscilloscope measurements help text

Math Functions

Measuring a signal as it exists is important, but what if you want to modify a signal? Examples of this might include “what would this signal pair look like after being passed through a differential amplifier?” or “what if I added a 5 MHz low pass filter to the circuit?” Our oscilloscopes have up to 27 math functions designed to manipulate signals in software to simulate many physical circuits. There are operators, transforms, filters, and visualizations.

Depending on the oscilloscope model, up to 4 of these can be displayed on screen simultaneously, and can save you significant development time. The subtract operator can be used on two analog channels to display the differential output, while the low pass filter can be used to emulate a 5 MHz filter on your signal, all without having to develop anything in hardware! The image below shows the simulated output of a signal through a 5 MHz low pass filter.

simulated output of a signal through a 5 MHz low pass filter on a Keysight oscilloscope

Analysis Tools

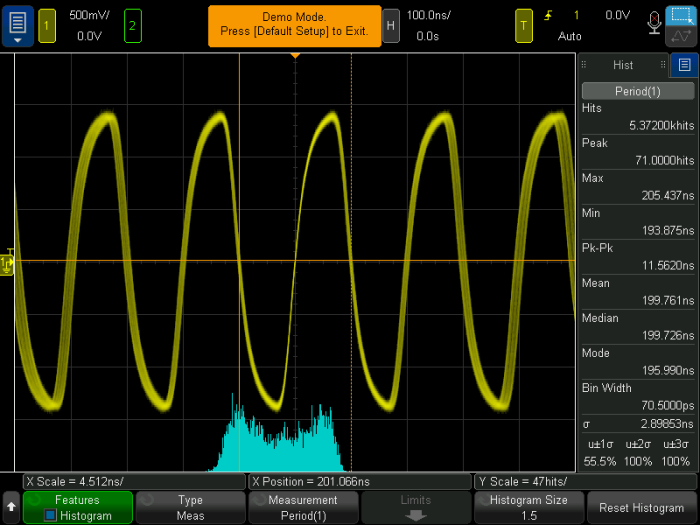
Some of the most powerful tools in the oscilloscope live in the analysis menu. Things like histograms, mask testing, eye diagrams, and frequency counters come as options in many models. While advanced triggers and measurements can help with isolating and characterizing a signal, the analysis tools in the oscilloscope are part of the final step of troubleshooting, which is root cause analysis. As an example, histograms can be used to visualize the distribution of measurements or waveforms. In this screenshot, we are looking at the distribution of period measurements over the course of a few minutes on a clock signal with some timing jitter. The shape of the histogram tells us the signal has periodic jitter due to its bimodal shape. Learn more about jitter here!

distribution of period measurements on a clock signal on a Keysight oscilloscope

Summary

After exploring each measurement, math function, and analysis tool, we take some time at the end of the webcast to show you real world examples of how all these functions can be combined to solve problems. The core purpose of an oscilloscope is to help you identify, isolate, and determine the root cause of physical layer issues in your design, and we sincerely believe that our scopes can help you do that easier and faster than anything out there! Check out the Advanced Oscilloscope Measurements and Analysis webcast video .

Thanks and happy watching!

Cool Oscilloscope Software You Might Not Know Exists

Cool Oscilloscope Software You Might Not Know Exists

With all of the recent advances in oscilloscope capability, it can be hard to keep up with the latest features and enhancements available. However, what you don’t know may hurt you since many of these were developed to make your job easier. Two recent examples of these types of enhancements are offline analysis software and MultiScope software.

Offline Analysis

Keysight engineers work closely with their fellow engineers to understand their needs and what makes their job difficult. This helps them decide what to work on next to help Keysight oscilloscope users like you. One example of this is the N8900A Infiniium Offline Oscilloscope Analysis Software. When the Keysight development team spoke to engineers, they heard three main reasons for wanting the ability to analyze data captured by an oscilloscope offline:

  • Documentation – The number one thing we heard from customers was the need for a more efficient documentation process. Many of them were fine in terms of using the oscilloscope and making measurements, but found documenting on the oscilloscope painful. It usually involved taking a bunch of screenshots, saving them off somewhere, importing them into a word processor, and then taking notes. The top request from these customers was to make offline software a tool people could use to document more quickly and easily. So, when Keysight engineers designed the N8900A offline software, they worked to accomplish just this and included many features that make documentation a breeze.
  • Time Savings – Oscilloscopes are expensive pieces of equipment, so the ability to use the oscilloscope just to capture data and then freeing it up for another team member while the data is analyzed on a PC or laptop saves a lot of time and makes the group more efficient. Plus, it can be easier to do all of your analysis from your laptop or PC instead of your oscilloscope.
  • Team collaboration – Teams that are geographically dispersed can find it difficult to share data. With offline software, one person can easily capture the data and then send it to anyone else who has the offline software so they see the exact same data, measurements, etc. Additionally, the offline software enables bookmarks and annotations that can be used to point to specific parts of the waveform as you share the data.

The Keysight N8900A offline software gives you the entire oscilloscope’s GUI on your PC, allowing you to easily analyze, document, or share data from the comfort of your laptop or PC. If you have not heard of this capability before, I highly encourage you to look into it. Learn more about how offline software can help you with your job in this application note: Three Reasons to Complement Your Scope Investment with PC-based Analysis Software.


MultiScope Software

Another request Keysight’s engineers heard was the need to use more than four channels with an oscilloscope. For example, engineers or technicians working on three phase power required more than four channels, but the oscilloscope industry lacked this capability. Two approaches emerged in the recent past. One approach was to create 8 channel oscilloscopes. The second one was to create oscilloscope software, known as MultiScope, where you could connect multiple oscilloscopes together. Keysight opted for the second approach for several reasons.

  1. We found that while engineers wanted the capability to use more than four channels, they did not always need this many channels and would often prefer the flexibility to bring oscilloscopes together when they needed them and split them apart when they did not. This allows better use of their equipment.
  2. Many customers needed even more than 8 channels and using MultiScope enables them to connect together up to 40 channels.

In other words, MultiScope software offers an engineer or technician more flexibility in terms of how their equipment is used. They can bring the scopes together when they need more than four channels (up to 40) and split them apart when multiples people need an oscilloscope.

After talking to many engineers, the Keysight Keysight N8834A MutiScope Application was developed. This software enables you to connect up to 10 oscilloscopes with any combination of 2000X, 3000T, 3000A, 4000X, 6000X, 7000B, 9000A, S-Series, 90000A, 90000X, Q, V, or Z-Series. The signals can be viewed on a single display either using the offline software described above or on the leader scope. This can be an incredibly powerful tool if you need more than four channels.

Here is the MultiScope data sheet for more information.


Summary

It is extremely useful to stay up-to-date on the latest capabilities of any test and measurement gear. Our engineers are constantly talking to fellow engineers regarding how we can make their lives easier or enable measurements not previously possible. Having access to this software, measurement, feature, or enhancement can enable you to finish your job quicker or perform it better. We will continue to update you on this blog when exciting new capabilities are available, and feel free to comment with your suggestions or feedback!


High Bandwidth Oscilloscope + Analysis Software = Powerful, Wideband RF Measurement Suite

High Bandwidth Oscilloscope + Analysis Software = Powerful, Wideband RF Measurement Suite

A change is coming in the tools for measurements in both pulsed RF aerospace/defense and I/Q vector-modulated communications application. Whether for multi-channel analysis or for wider analysis bandwidth, high-bandwidth oscilloscopes are taking the place of traditional spectrum and signal analyzers. That’s because they can handle signals with spectral content beyond 1 or 2 GHz. These signals are being created to support the higher resolution requirements in radar systems and move the vast amounts of information in new communications systems.

So how do you create a powerful, wideband RF measurement suite? By coupling a high-bandwidth real-time oscilloscope with RF analysis software. Once you’ve married the two, you achieve a number of enhancements:

  • Noise reduction through digital down-conversion
  • A wide range of vertical scaling options, including linear and log magnitude
  • Key RF measurements including occupied bandwidth (OBW) and power spectral density (PSD)
  • Vector demodulation options for communications formats like QAM16
  • Analog demodulation options including AM, FM and PM
  • Set-up of segmented memory capture
  • Statistical pulse analysis

 
Pulse amplitude, frequency, phase, and FFT measurements

For radar and electronic warfare applications, it’s helpful to perform a variety of measurements on many pulses. This includes things like amplitude variation, frequency, and phase shift across pulses, and a view of the spectrum of signals. For applications such as aircraft warning receivers, you also want the capability to measure time difference and phase difference between pulses associated with the capture of a wave front by multiple antennas on an aircraft. Let’s consider some of these measurements.

In the simplest case, you can measure the basic pulse amplitude, frequency shift, and phase shift across the measured RF pulse. The RF pulse train is sampled by the oscilloscope and then digitally down-converted to reduce noise and allow further signal processing.

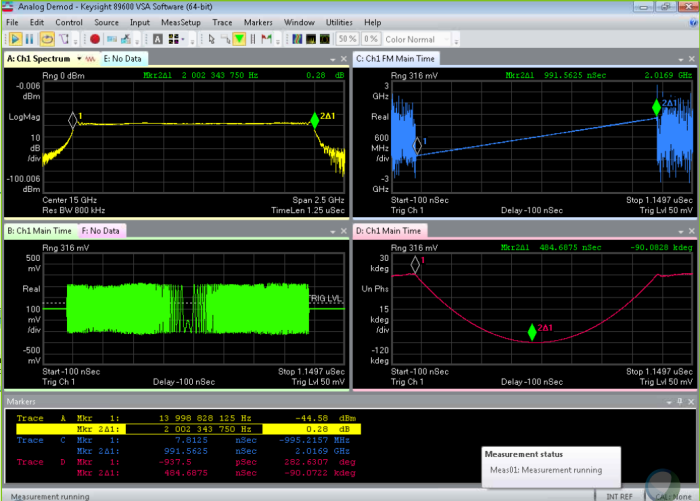
For example, in Figure 1, a 15-GHz carrier, 2-GHz-wide linear FM chirped RF pulse signal is shown after vector signal analysis (VSA) processing. Here’s what the image shows:

  • 2 GHz-wide spectral content of the signal (upper left);
  • Real part of the down-converted I/Q data (lower left);
  • 2-GHz-wide linear FM frequency chirp seen across the RF pulse (upper right);
  • parabolic phase shift seen across the RF pulse (lower right).

These measurements are taken in the “Vector” measurement mode.

Basic vector mode analysis of FFT
Basic vector mode analysis of FFT, real part of I/Q, FM chirp, and phase shift across pulse seen


Single channel, segmented memory capture, statistical RF pulse analysis

The next level of analysis requires a shift into “Pulse Analysis” mode. Here we use multiple oscilloscope channels to capture RF pulse signals into segments of oscilloscope memory. These are digitally down-converted into baseband I/Q signals, and then evaluated for single and multiple channel pulse analysis. For single-channel measurement, you can make three comparisons:

  • the linear FM frequency chirp to an ideal, best-fit linear FM chirp signal;
  • the phase shift across a pulse to a best-fit parabolic phase shift profile;
  • the amplitude of the pulse envelope to a best fit ideal straight-line best fit reference.

In Figure 2, you’ll see these comparisons being made between measured to reference, and then the “error” between the measured and reference is expanded in vertical scale for a close view.

A pulse table also displays RF pulse parameters, including an RMS error calculation between the measured frequency or phase across the pulse, compared to a best-fit reference signal. It’s also possible to show statistics for the measurements over all the pulses.

Keysight single-ch spectrum amplitude phase and frequency measurements
Single-channel spectrum, amplitude, phase, and frequency measurements vs. best-fit reference signals


Dual-channel delta pulse amplitude, frequency, and time-delay measurements

You can also make “two-channel delta” measurements, as shown in Figure 3. These measurements are becoming increasingly important in applications such as aircraft warning receiver testing, where multiple signals are being captured from multiple antennas. The time delay and frequency difference of arrival between wave fronts must be measured for angle-of-arrival calculations.

Notice in this example a 1 nsec time delay being measured between two RF pulses. You’ll also see a 0.2-dB difference in amplitude and a 16-kHz difference in frequency, on average.

Pulse analysis is also performed on three of ten captured pulses that are being placed into oscilloscope memory segments. The parabolic phase shift across pulses (lower left), the linear FM chirp frequency shift across pulses (middle right), and the pulse envelope of pulses (upper left) are superimposed for signals coming into two oscilloscope channels. As in the previous example, each scope-channel measured signal can have the measured, reference, and error signal calculations made. Finally, the FFT spectral content for both scope-channel captures of the two pulse trains (center left) is also shown.

Keysight 2 channel measurements of RF pulse characteristics
Two-channel measurements of RF pulse characteristics including time, amplitude, and frequency difference between two channels


Cross-correlation between pulses for precise time-delay measurements between RF pulses

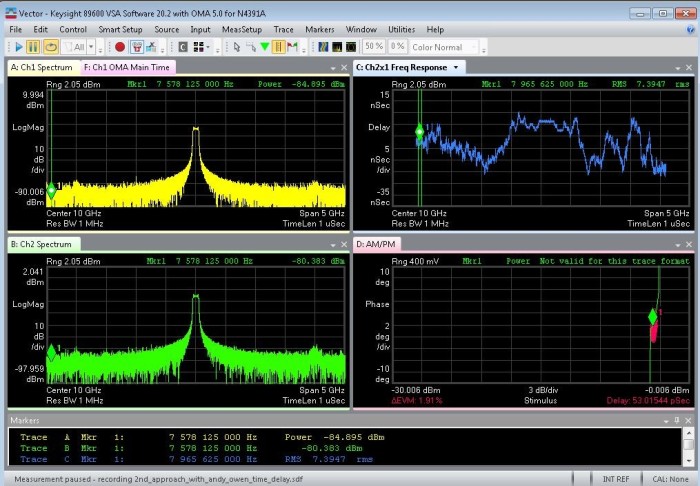
In the aircraft warning receiver example mentioned previously, you can determine very precise measurements of time delay between RF pulses captured on different antennas on an aircraft by using a cross-correlation measurement between pulses. In Figure 4, a 50-psec time difference of arrival (TDOA) is being measured between two RF pulses captured on two scope input channels. Here pulses have a 10-GHz carrier, 100-MHz-wide linear FM chirp modulation, and a 1-usec width. In this measurement, you can first remove the channel-to-channel skew between oscilloscope channels, including cable delays at the temperature measurements will be taken, through de-embedding. Then a measurement can be made to see the actual time shift between the captured signals. Measurements show a mean delay of 50 psec, with a peak-to-peak variation in delay between 47 psec and 53 psec.

Two-channel cross-correlation measurement for precise time delay between pulses


Math function used to measure phase shift between two RF pulses

The difference in phase between two RF pulses is also critical in a variety of radar/EW/warning receiver-oriented applications. Through the use of math functions, the measured phase across one pulse can be subtracted from the measured phase across a second pulse, measured on two oscilloscope input channels. We can measure the same two linear FM chirp signals from the last example to view the phase shift between the two pulse trains by comparing related pulses. Again this might be seen from two antennas on an aircraft. The time shift has now been set to zero on an arbitrary waveform generator, but a 25-degree phase shift is being introduced between the two signals. A capture shown in Figure 5, top center trace C, and related blue marker 1, show this 25-degree phase shift in a mean measurement in lower right Trace D, as well as only a 0.8-degree standard deviation and a 0.7 variance.  These are average values over the width of the pulses.

Two-channel phase difference measurement between two RF pulses


Summary

More radar/EW/warning receiver applications are driving toward wider modulation bandwidths to increase range and angle-of-arrival precision capability in related systems. At times, this extends beyond 1-GHz modulation bandwidths. Designers increasingly use wideband oscilloscopes as RF receivers to evaluate related wideband signals when validating their hardware prototypes. Although scope measurements directly are of interest, it’s often advantageous to use analysis software to digitally down-convert captured wideband signals to reduce noise and allow more in-depth analysis of baseband I/Q signals. By combining a wideband scope and VSA software with appropriate techniques, you can readily make angle-of-arrival calculations for a variety of systems.